Beattyville: Fire Incidents, Kentucky (KY)
Where are fire incidents reported in Beattyville, KY
Something went wrong! Please refresh the page.
|
| |||||||||||||||||||||||||||||||||||||||||||||||||||||||||||||||||||||||||||||||||||||||||||||||||||||||||||||
| Other | 313 | |||||||||||||||||||||||||||||||||||||||||||||||||||||||||||||||||||||||||||||||||||||||||||||||||||||||||||||
2003 - 2018 National Fire Incident Reporting System (NFIRS) incidents
- Incident types reported to NFIRS in Beattyville, KY
- 81954.9%Fire
- 33122.2%Rescue & EMS
- 23015.4%Hazardous Condition
- 483.2%Good Intent Call
- 422.8%Service Call
- 130.9%False Alarm
- 60.4%Special Incident
- 20.1%Overpressure Rupture
- Fire incident types reported to NFIRS in Beattyville, KY
- 50261.3%Structure Fires
- 16319.9%Outside Fires
- 9411.5%Mobile Property/Vehicle Fires
- 607.3%Other
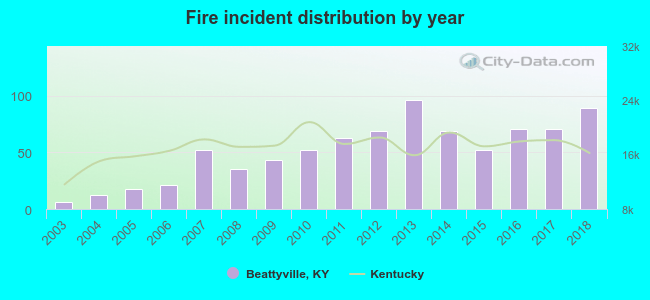 Based on the data from the years 2003 - 2018 the average number of fires per year is 51. The highest number of reported fire incidents - 96 took place in 2013, and the least - 6 in 2003. The data has a growing trend.
 The median response time based on all reported fire incidents is 7 minutes. This is comparable to the Kentucky median value.
The median response time in Beattyville, KY compared to nearest cities:
(Note: Based on data for all years, including only cities with at least 500 fire incidents)
| Beattyville: | 7 minutes |
| Campton: | 10 minutes |
| Irvine: | 13 minutes |
| Jackson: | 10 minutes |
| McKee: | 11 minutes |
| Manchester: | 10 minutes |
| Berea: | 9 minutes |
| Richmond: | 7 minutes |
| East Bernstadt: | 10 minutes |
 34.4% incidents where reported in the morning and 65.6% in the evening. The most fires (17.2%) took place on Tuesday, and the least (12.7%) on Monday.
 Based on the 819 fires from years 2003 - 2018 most fires (11.4%) took place during January, and the least (4.8%) in August.
 Out of all 1,491 cases reported during the years 2003 - 2018, the most belonged to the categories: Fire (54.9%), Rescue & EMS (22.2%), and Hazardous Condition (15.4%).
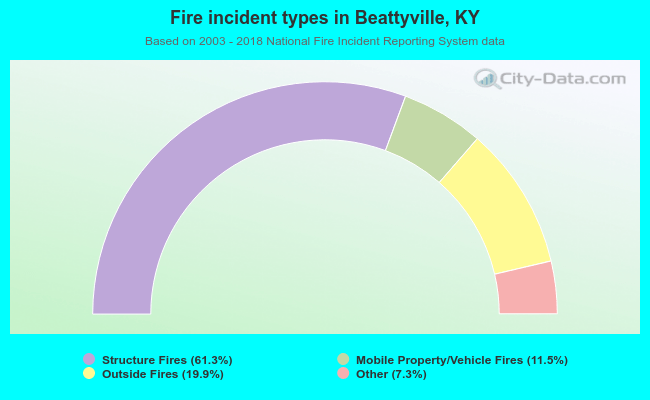 When looking into fire subcategories, the most reports belonged to: Structure Fires (61.3%), and Outside Fires (19.9%).