Bayside: Fire Incidents, Wisconsin (WI)
Where are fire incidents reported in Bayside, WI
Something went wrong! Please refresh the page.
|
| |||||||||||||||||||||||||||||||||||||||||||||||||||||||||||||||||||||||||||||||||||||||||||||||||||||||||||||
2003 - 2018 National Fire Incident Reporting System (NFIRS) incidents
- Incident types reported to NFIRS in Bayside, WI
- 1,18865.4%Rescue & EMS
- 18910.4%Hazardous Condition
- 18610.2%False Alarm
- 1297.1%Fire
- 603.3%Service Call
- 522.9%Good Intent Call
- 80.4%Special Incident
- 40.2%Overpressure Rupture
- Fire incident types reported to NFIRS in Bayside, WI
- 8666.7%Structure Fires
- 1814.0%Mobile Property/Vehicle Fires
- 1612.4%Outside Fires
- 97.0%Other
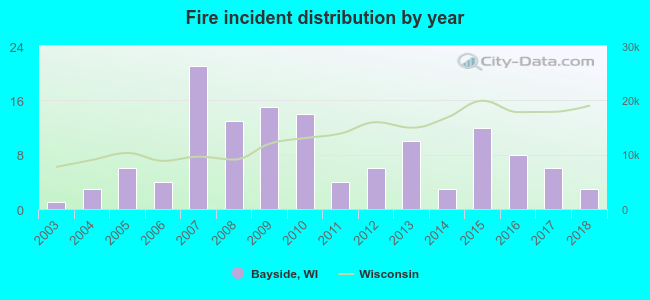 Based on the data from the years 2003 - 2018 the average number of fires per year is 8. The highest number of fires - 21 took place in 2007, and the least - 1 in 2003. The data has an increasing trend.
 26.4% incidents where reported in the morning and 73.6% in the evening. The most fires (20.2%) took place on Friday, and the least (10.9%) on Tuesday.
 Based on the 129 incident reports from years 2003 - 2018 most fires (13.2%) took place during August, and the least (3.9%) in March.
 Out of all 1,816 cases reported during the years 2003 - 2018, the most belonged to the categories: Rescue & EMS (65.4%), Hazardous Condition (10.4%), and False Alarm (10.2%).
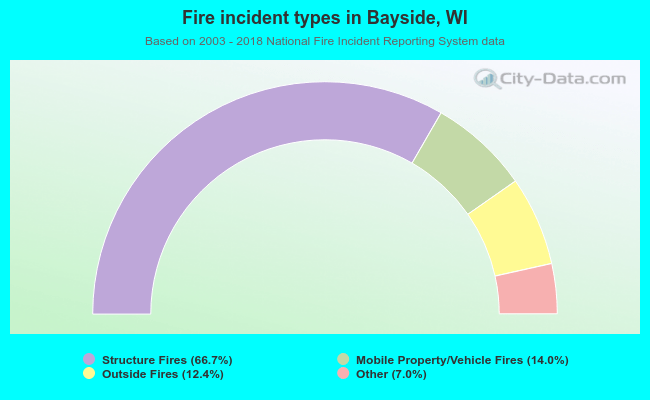 When looking into fire subcategories, the most incidents belonged to: Structure Fires (66.7%), and Mobile Property/Vehicle Fires (14.0%).