| Fire incidents reported |
|---|
| Sreet name | Count |
|---|
| WINTZELL AVE | 119 | | LITTLE RIVER RD | 90 | | SHELL BELT RD | 88 | | JERNBURG AVE | 40 | | POWELL AVE | 40 | | UNIVERSITY RD | 40 | | WARNER ST | 38 | | ALBA ST | 35 | | RAILROAD ST | 30 | | DAVENPORT ST | 25 | | HEMLEY RD | 25 | | CITY DOCKS | 20 | | CITY DOCKS RD | 20 | | SEAFOOD HOUSE RD | 20 | | SHELLBELT RD | 18 | | HEMLEY ST | 15 | | LITTLE RIVER RD | 15 | | MARINE LAB RD | 15 | | SATSUMA ST | 15 | | ADAMS ST | 10 | | BRYANT | 10 | | DAVENPORT RD | 10 | | DEBRA LN | 10 | | DELCAMBRE ST | 10 | | DOWNEY ST | 10 |
| | | Fire incidents reported |
|---|
| Sreet name | Count |
|---|
| E RABBY ST | 10 | | HWY 188 HWY | 10 | | HWY. 188 | 10 | | LANDRY AVE | 10 | | LITTLE RIVER | 10 | | LITTLE RIVER ROAD | 10 | | PIRTLE | 10 | | POWELL | 10 | | RAILROAD | 10 | | TRAM AVE | 10 | | WALKER RD | 10 | | WINTZELL AVE | 10 | | WOODRUFF AVE | 10 | | PADGETT SWITCH RD | 9 | | RASMUSSEN ST | 9 | | CITY DOCK RD | 8 | | 11434 PADGETT SWITCH | 5 | | 11500 HENDERSON CAMP RD | 5 | | 13960 WOODRUFF AVE | 5 | | 14155 S WINTZELL AVE | 5 | | 14301 WINTZELL | 5 | | 14595 RIVA RD | 5 | | 581 E RABBY ST | 5 | | 8400 MCKEE RD | 5 | | 8450 BAYOU DR | 5 |
|
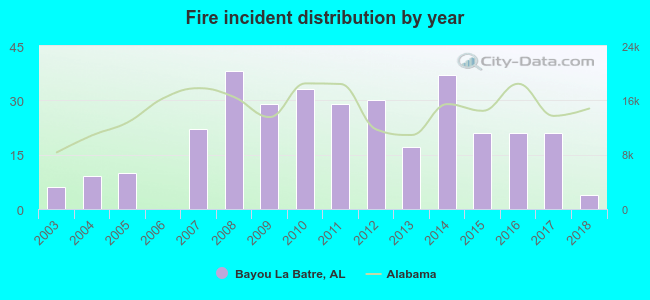 According to the data from the years 2003 - 2018 the average number of fires per year is 20. The highest number of reported fire incidents - 38 took place in 2008, and the least - 0 in 2006. The data has a declining trend.
 23.2% incidents where reported in the morning and 76.8% in the evening. The most fires (19.3%) took place on Monday, and the least (11.9%) on Tuesday.
 Based on the 327 fire incident reports from years 2003 - 2018 most fires (14.1%) took place during December, and the least (4.0%) in June.
 Out of all 1,960 cases reported during the years 2003 - 2018, the most belonged to the categories: Overpressure Rupture (72.9%), Fire (16.7%), and Hazardous Condition (3.2%).
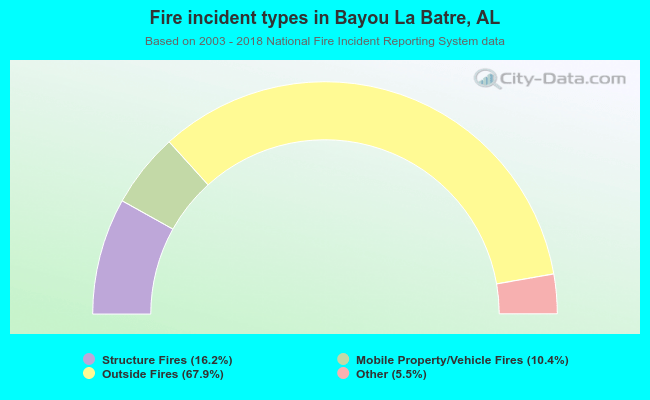 When looking into fire subcategories, the most reports belonged to: Outside Fires (67.9%), and Structure Fires (16.2%).