Bath: Fire Incidents, Michigan (MI)
Where are fire incidents reported in Bath, MI
Something went wrong! Please refresh the page.
|
| |||||||||||||||||||||||||||||||||||||||||||||||||||||||||||||||||||||||||||||||||||||||||||||||||||||||||||||
2002 - 2018 National Fire Incident Reporting System (NFIRS) incidents
- Incident types reported to NFIRS in Bath, MI
- 33552.8%Fire
- 11418.0%Hazardous Condition
- 8112.8%Rescue & EMS
- 436.8%Good Intent Call
- 314.9%False Alarm
- 213.3%Service Call
- 60.9%Severe Weather
- 20.3%Overpressure Rupture
- 10.2%Special Incident
- Fire incident types reported to NFIRS in Bath, MI
- 14443.0%Structure Fires
- 12838.2%Outside Fires
- 5817.3%Mobile Property/Vehicle Fires
- 51.5%Other
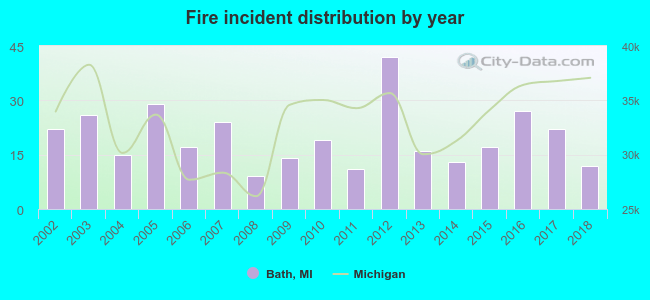 According to the data from the years 2002 - 2018 the average number of fires per year is 20. The highest number of reported fires - 42 took place in 2012, and the least - 9 in 2008. The data has a decreasing trend.
 32.5% incidents where reported in the morning and 67.5% in the evening. The most fires (15.8%) took place on Tuesday, and the least (12.2%) on Friday.
 According to the 335 reports from years 2002 - 2018 most fires (12.5%) took place during April, and the least (5.1%) in September.
 Out of all 634 cases reported during the years 2002 - 2018, the most belonged to the categories: Fire (52.8%), Hazardous Condition (18.0%), and Rescue & EMS (12.8%).
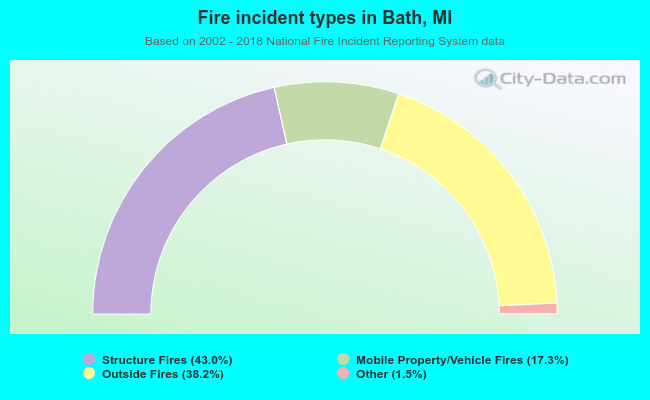 When looking into fire subcategories, the most reports belonged to: Structure Fires (43.0%), and Outside Fires (38.2%).