Batavia: Fire Incidents, Illinois (IL)
Where are fire incidents reported in Batavia, IL
Something went wrong! Please refresh the page.
| Fire incidents reported | |
|---|---|
| Sreet name | Count |
| WILSON ST | 220 |
| RANDALL RD | 176 |
| KIRK RD | 126 |
| BATAVIA AVE | 98 |
| RADDANT RD | 86 |
| LORLYN CIR | 78 |
| MAIN ST | 70 |
| RIVER ST | 68 |
| KINGSLAND DR | 62 |
| FABYAN PKY | 60 |
| DOUGLAS RD | 56 |
| CARLISLE RD | 38 |
| JEFFERSON ST | 38 |
| LATHEM ST | 36 |
| DEERPATH RD | 32 |
| HUNTER DR | 28 |
| VAN BUREN ST | 28 |
| BRANDYWINE CIR | 26 |
| WALNUT ST | 26 |
| WASHINGTON AVE | 26 |
| HARRISON ST | 24 |
| HART RD | 24 |
| ISLAND AVE | 24 |
| MCKEE ST | 24 |
| CHURCH ST | 22 |
| FABYAN PKWY | 22 |
| MILL ST | 22 |
| OLYMPIC DR | 22 |
| MALLORY AVE | 20 |
| MORTON ST | 20 |
2002 - 2018 National Fire Incident Reporting System (NFIRS) incidents
- Incident types reported to NFIRS in Batavia, IL
- 10,52053.3%Rescue & EMS
- 2,64613.4%False Alarm
- 2,01710.2%Hazardous Condition
- 1,8579.4%Service Call
- 1,4877.5%Fire
- 1,1565.9%Good Intent Call
- 280.1%Overpressure Rupture
- Fire incident types reported to NFIRS in Batavia, IL
- 83055.8%Structure Fires
- 39526.6%Outside Fires
- 1459.8%Mobile Property/Vehicle Fires
- 1177.9%Other
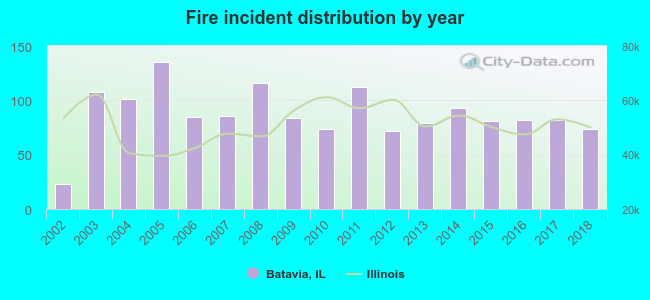 Based on the data from the years 2002 - 2018 the average number of fire incidents per year is 87. The highest number of reported fire incidents - 135 took place in 2005, and the least - 23 in 2002. The data has an increasing trend.
The average number of yearly fire incidents per 10k residents in Batavia, IL compared to nearest cities:
(Note: Based on data for the last 3 years, including only cities with population 5,000 and above)
| Batavia: | 30.0 |
| Geneva: | 36.2 |
| North Aurora: | 16.9 |
| West Chicago: | 40.1 |
| Aurora: | 11.7 |
| Warrenville: | 33.7 |
| Winfield: | 33.8 |
| Montgomery: | 37.0 |
| Sugar Grove: | 41.0 |
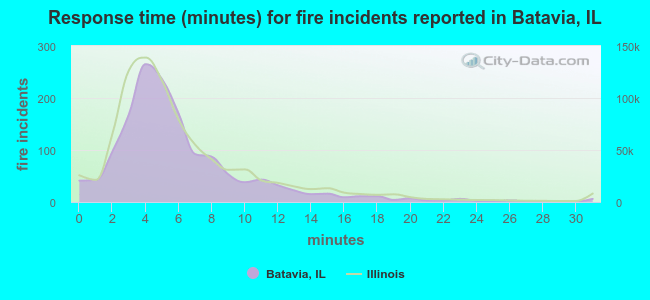 The median response time based on all reported fire incidents is 5 minutes. This is similar to the Illinois median value.
The median response time in Batavia, IL compared to nearest cities:
(Note: Based on data for all years, including only cities with at least 500 fire incidents)
| Batavia: | 5 minutes |
| Geneva: | 5 minutes |
| North Aurora: | 5 minutes |
| St. Charles: | 5 minutes |
| West Chicago: | 6 minutes |
| Aurora: | 5 minutes |
| Warrenville: | 5 minutes |
| Winfield: | 5 minutes |
| Montgomery: | 6 minutes |
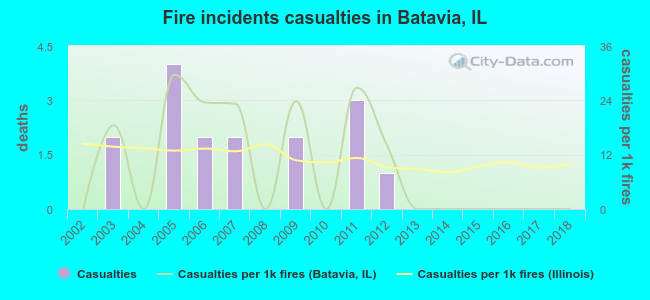 Based on the reports from the years 2002 - 2018 the average number of fire-related casualties per year is 1. The highest number of casualties - 4 took place in 2005, and the lowest - 0 in 2002. The data has a constant trend.
The average number of injuries per 1,000 fire incidents is 9. This indicator was the highest - 30 in 2005, and the lowest 0 in 2002. The trend for injuries per 1,000 fire incidents is increasing. Compared to the Illinois value the number of injuries per 1,000 incidents is about the same.
Based on the reports from the years 2002 - 2018 the average number of fire-related casualties per year is 1. The highest number of casualties - 4 took place in 2005, and the lowest - 0 in 2002. The data has a constant trend.
The average number of injuries per 1,000 fire incidents is 9. This indicator was the highest - 30 in 2005, and the lowest 0 in 2002. The trend for injuries per 1,000 fire incidents is increasing. Compared to the Illinois value the number of injuries per 1,000 incidents is about the same.Casualties per 1,000 incidents in Batavia, IL compared to nearest cities:
(Note: Based on data for all years, including only cities with at least 500 fire incidents)
| Batavia: | 10.8 |
| Geneva: | 4.5 |
| North Aurora: | 0.0 |
| St. Charles: | 7.9 |
| West Chicago: | 20.6 |
| Aurora: | 14.2 |
| Warrenville: | 33.4 |
| Winfield: | 3.4 |
| Montgomery: | 20.3 |
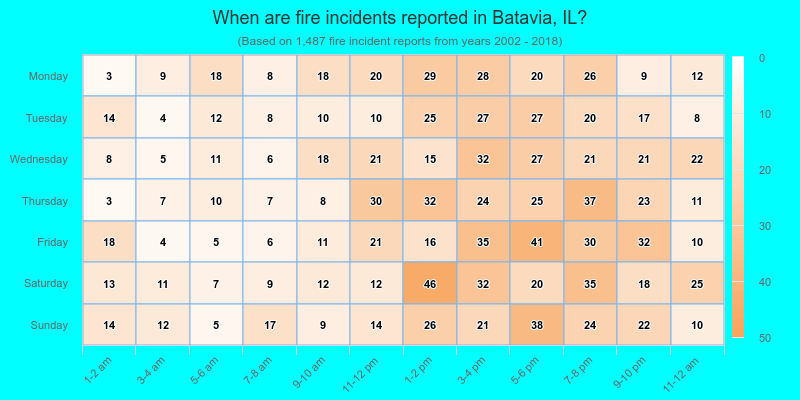
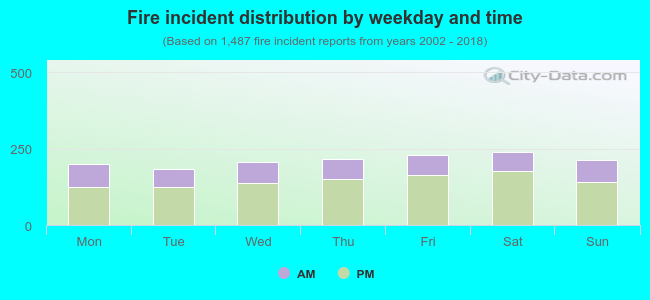 31.5% incidents where reported in the morning and 68.5% in the evening. The most fires (16.1%) took place on Saturday, and the least (12.2%) on Tuesday.
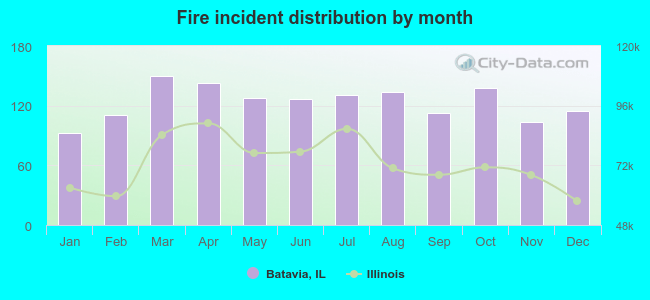 Based on the 1,487 incident reports from years 2002 - 2018 most fires (10.1%) took place during March, and the least (6.3%) in January.
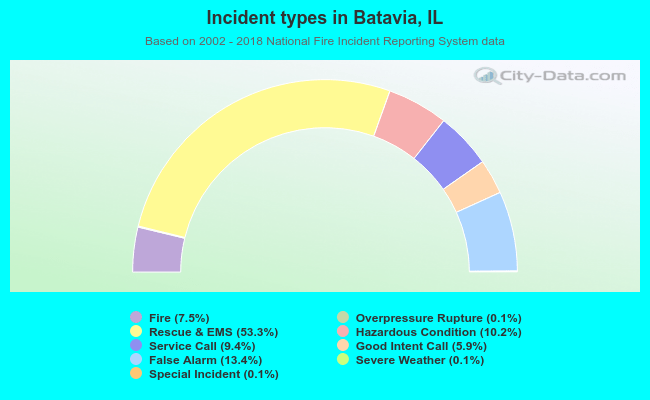 Out of all 19,739 cases reported during the years 2002 - 2018, the most belonged to the categories: Rescue & EMS (53.3%), False Alarm (13.4%), and Hazardous Condition (10.2%).
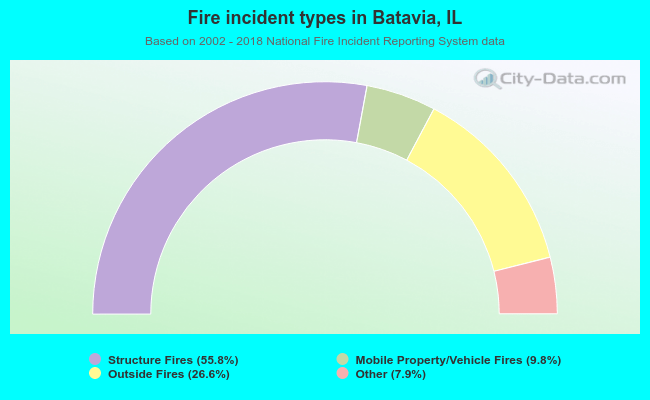 When looking into fire subcategories, the most incidents belonged to: Structure Fires (55.8%), and Outside Fires (26.6%).