Barry: Fire Incidents, Illinois (IL)
Where are fire incidents reported in Barry, IL
Something went wrong! Please refresh the page.
|
| |||||||||||||||||||||||||||||||||||||||||||||||||||||||||||||||||||||||||||||||||||||||||||||||||||||||||||||
| Other | 41 | |||||||||||||||||||||||||||||||||||||||||||||||||||||||||||||||||||||||||||||||||||||||||||||||||||||||||||||
2002 - 2017 National Fire Incident Reporting System (NFIRS) incidents
- Incident types reported to NFIRS in Barry, IL
- 24753.2%Fire
- 17337.3%Rescue & EMS
- 255.4%Good Intent Call
- 132.8%Hazardous Condition
- 40.9%False Alarm
- 20.4%Service Call
- Fire incident types reported to NFIRS in Barry, IL
- 12450.2%Outside Fires
- 7028.3%Structure Fires
- 4618.6%Mobile Property/Vehicle Fires
- 72.8%Other
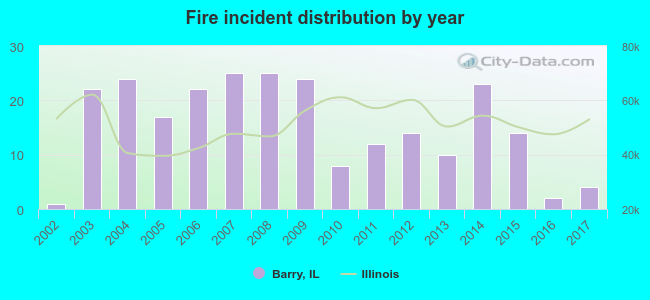 According to the data from the years 2002 - 2017 the average number of fire incidents per year is 15. The highest number of reported fire incidents - 25 took place in 2007, and the least - 1 in 2002. The data has an increasing trend.
 28.7% incidents where reported in the morning and 71.3% in the evening. The most fires (19.4%) took place on Saturday, and the least (9.3%) on Thursday.
 Based on the 247 fire incident reports from years 2002 - 2017 most fires (17.4%) took place during March, and the least (4.5%) in May.
 Out of all 464 cases reported during the years 2002 - 2017, the most belonged to the categories: Fire (53.2%), Overpressure Rupture (37.3%), and Service Call (5.4%).
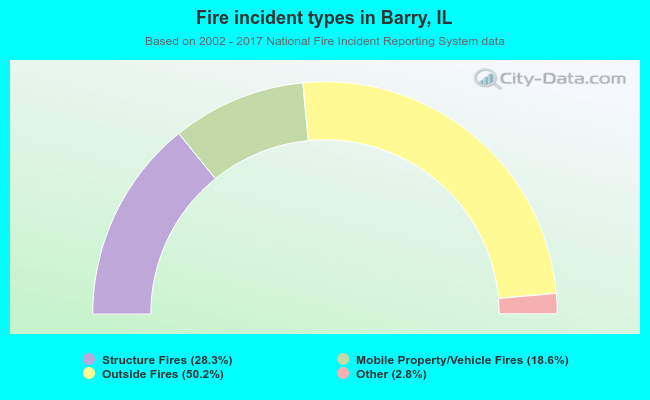 When looking into fire subcategories, the most reports belonged to: Outside Fires (50.2%), and Structure Fires (28.3%).