| Fire incidents reported |
|---|
| Sreet name | Count |
|---|
| SHAWNEE RD | 42 | | SNOW RD | 24 | | HOLDEN RD | 22 | | CLEVELAND AVE | 20 | | HILLS RD | 12 | | LANDON RD | 10 | | LEMON CREEK RD | 10 | | MILLER RD | 10 | | RUGGLES RD | 10 | | RUSSELL RD | 10 | | STEVENSVILLE BARODA RD | 10 | | STEVENSVILLEBARODA RD | 10 | | GRAY RD | 8 | | HINCHMAN RD | 8 | | SECOND ST | 8 | | AMY DR | 6 | | BROWNTOWN RD | 6 | | HOLLYWOOD RD | 6 | | MARLENE DR | 6 | | MARRS RD | 6 | | STEVENSVILLE-BARODA RD | 6 | | CLEVELAND RD | 4 | | CLEVELAND ST | 4 | | DATE RD | 4 | | FIRST ST | 4 |
| | | Fire incidents reported |
|---|
| Sreet name | Count |
|---|
| KEEHN RD | 4 | | LINCO RD | 4 | | SINGER LAKE RD | 4 | | 10756 HILLS RD | 2 | | 1170 HINCHMAN RD | 2 | | 1ST ST | 2 | | 2ND ST | 2 | | 484 LEMON CREEK RD | 2 | | 6760 TOTZKE RD | 2 | | 7404 LINCOLN AVE | 2 | | 7730 HOLLYWOOD RD | 2 | | 8462 CLEVELAND AVE | 2 | | 8676 GRAY RD | 2 | | 8893 STEVENSVILLEBARODA RD | 2 | | 9125 SECOND ST | 2 | | BARODA TAP GRILL | 2 | | CHURCH | 2 | | CLEVELAND STRE | 2 | | DEMORROW CIR | 2 | | EAGLE CREST DR | 2 | | HARBERT RD | 2 | | HICKORY CREEK DR | 2 | | HIDDEN PATH | 2 | | HILL RD | 2 | | HINCHMAN ST | 2 |
|
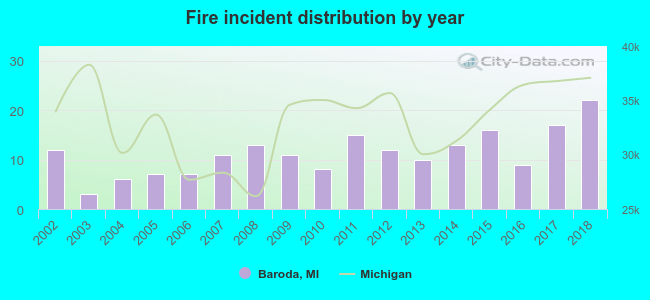 Based on the data from the years 2002 - 2018 the average number of fire incidents per year is 11. The highest number of reported fire incidents - 22 took place in 2018, and the least - 3 in 2003. The data has a rising trend.
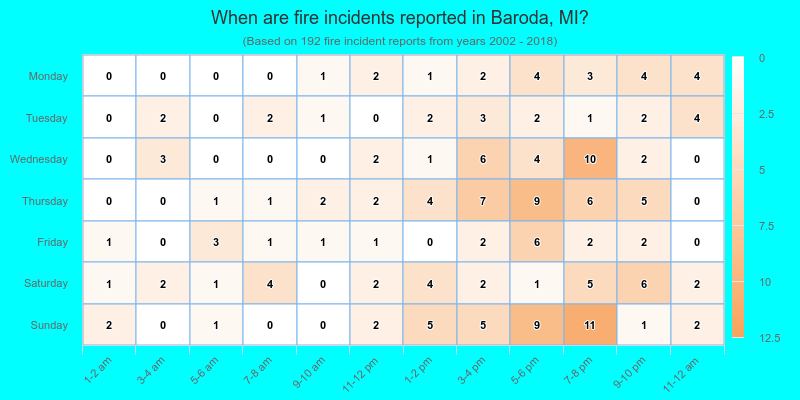
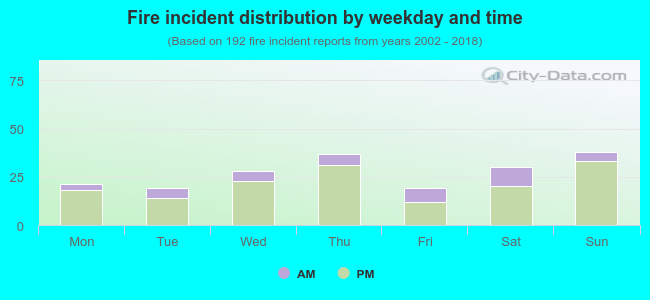 21.4% incidents where reported in the morning and 78.6% in the evening. The most fires (19.8%) took place on Sunday, and the least (9.9%) on Tuesday.
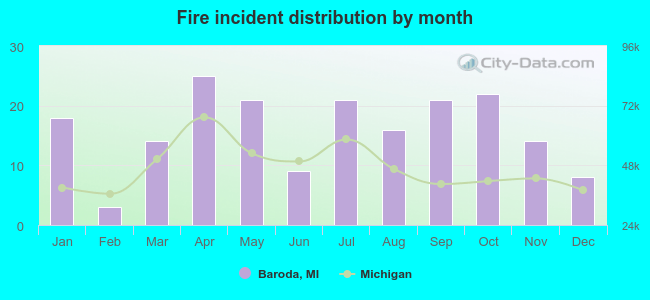 Based on the 192 fires from years 2002 - 2018 most fires (13.0%) took place during April, and the least (1.6%) in February.
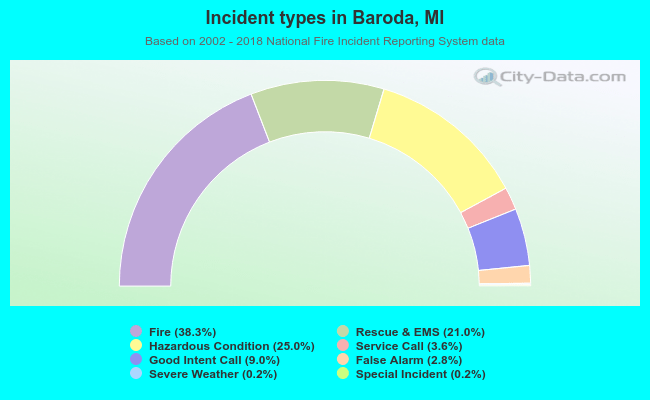 Out of all 501 cases reported during the years 2002 - 2018, the most belonged to the categories: Fire (38.3%), Rescue & EMS (25.0%), and Overpressure Rupture (21.0%).
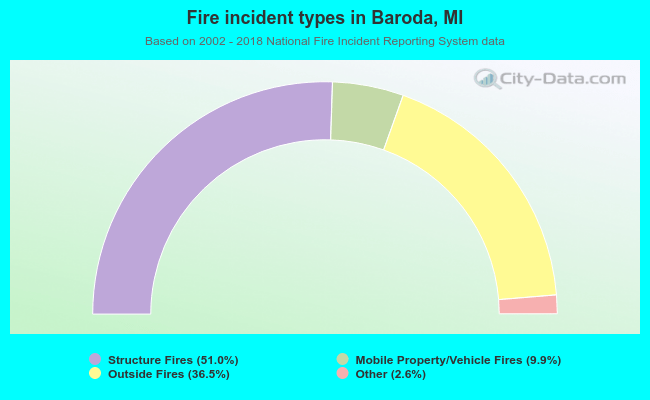 When looking into fire subcategories, the most reports belonged to: Structure Fires (51.0%), and Outside Fires (36.5%).