Barnwell: Fire Incidents, South Carolina (SC)
Where are fire incidents reported in Barnwell, SC
Something went wrong! Please refresh the page.
|
| |||||||||||||||||||||||||||||||||||||||||||||||||||||||||||||||||||||||||||||||||||||||||||||||||||||||||||||
| Other | 387 | |||||||||||||||||||||||||||||||||||||||||||||||||||||||||||||||||||||||||||||||||||||||||||||||||||||||||||||
2004 - 2018 National Fire Incident Reporting System (NFIRS) incidents
- Incident types reported to NFIRS in Barnwell, SC
- 1,03149.8%Fire
- 35217.0%Hazardous Condition
- 34216.5%Rescue & EMS
- 1718.3%Good Intent Call
- 1014.9%False Alarm
- 522.5%Service Call
- 160.8%Severe Weather
- 40.2%Overpressure Rupture
- 30.1%Special Incident
- Fire incident types reported to NFIRS in Barnwell, SC
- 52250.6%Outside Fires
- 39538.3%Structure Fires
- 1019.8%Mobile Property/Vehicle Fires
- 131.3%Other
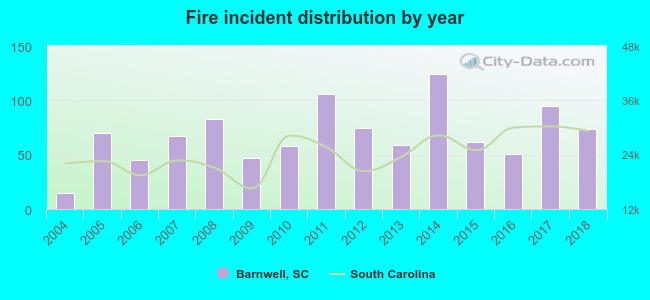 Based on the data from the years 2004 - 2018 the average number of fires per year is 69. The highest number of fires - 124 took place in 2014, and the least - 15 in 2004. The data has an increasing trend.
 The median response time based on all reported fire incidents is 9 minutes. This is higher compared to the state median value.
The median response time in Barnwell, SC compared to nearest cities:
(Note: Based on data for all years, including only cities with at least 500 fire incidents)
| Barnwell: | 9 minutes |
| Williston: | 6 minutes |
| Denmark: | 7 minutes |
| Allendale: | 10 minutes |
| Bamberg: | 6 minutes |
| Fairfax: | 13 minutes |
| Cope: | 9 minutes |
| Neeses: | 11 minutes |
| Wagener: | 10 minutes |
 24.4% incidents where reported in the morning and 75.6% in the evening. The most fires (15.9%) took place on Thursday, and the least (13.1%) on Wednesday.
 Based on the 1,031 fire incident reports from years 2004 - 2018 most fires (14.1%) took place during March, and the least (4.8%) in July.
 Out of all 2,072 cases reported during the years 2004 - 2018, the most belonged to the categories: Fire (49.8%), Hazardous Condition (17.0%), and Rescue & EMS (16.5%).
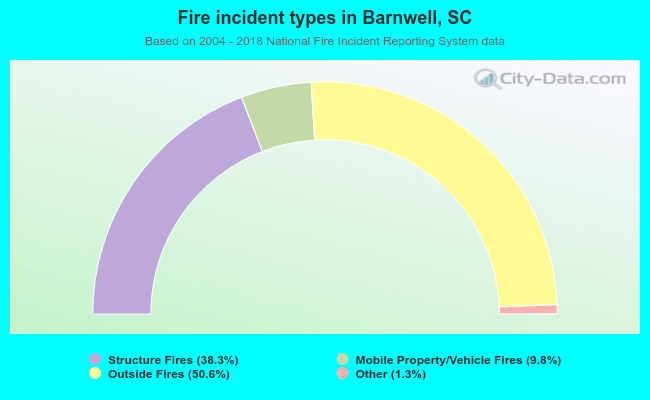 When looking into fire subcategories, the most incidents belonged to: Outside Fires (50.6%), and Structure Fires (38.3%).