Bally: Fire Incidents, Pennsylvania (PA)
Where are fire incidents reported in Bally, PA
Something went wrong! Please refresh the page.
|
| |||||||||||||||||||||||||||||||||||||||||||||||||||||||||||||||||||||||||||||||||||||||||||||||||||||||||||||
2003 - 2017 National Fire Incident Reporting System (NFIRS) incidents
- Incident types reported to NFIRS in Bally, PA
- 10068.5%Fire
- 1611.0%Service Call
- 138.9%Hazardous Condition
- 85.5%Good Intent Call
- 53.4%Rescue & EMS
- 21.4%False Alarm
- 21.4%Severe Weather
- Fire incident types reported to NFIRS in Bally, PA
- 6969.0%Structure Fires
- 1919.0%Outside Fires
- 1111.0%Mobile Property/Vehicle Fires
- 11.0%Other
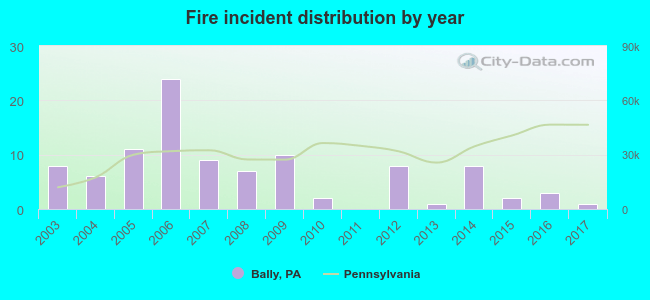 Based on the data from the years 2003 - 2017 the average number of fires per year is 7. The highest number of reported fires - 24 took place in 2006, and the least - 0 in 2011. The data has a declining trend.
 36.0% incidents where reported in the morning and 64.0% in the evening. The most fires (24.0%) took place on Friday, and the least (9.0%) on Thursday.
 Based on the 100 reports from years 2003 - 2017 most fires (18.0%) took place during March, and the least (1.0%) in June.
 Out of all 146 cases reported during the years 2003 - 2017, the most belonged to the categories: Fire (68.5%), Hazardous Condition (11.0%), and Rescue & EMS (8.9%).
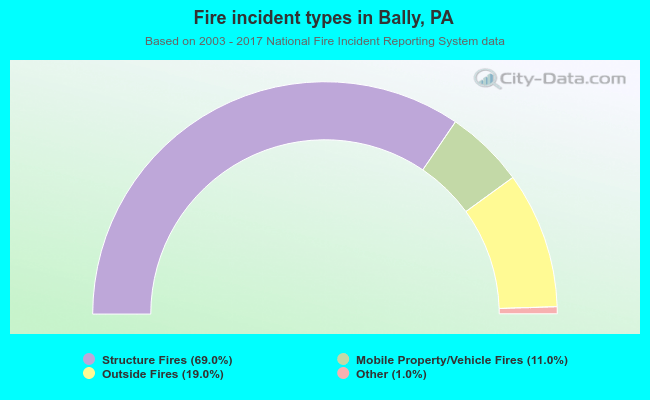 When looking into fire subcategories, the most incidents belonged to: Structure Fires (69.0%), and Outside Fires (19.0%).