| Fire incidents reported |
|---|
| Sreet name | Count |
|---|
| 10901 BALDWIN ROAD | 14 | | BALDWIN RD | 12 | | BALDWIN ROAD | 8 | | FIFTH ST | 6 | | 10318 SHERIDAN ROAD | 4 | | 310 E. CHURCH STREET | 4 | | BALDWIN RD | 4 | | CHESTNUT | 4 | | FALLVIEW RD | 4 | | STATE ROUTE 156 | 4 | | STATE RT 154 | 4 | | STRINGTOWN RD | 4 | | 1 ST | 2 | | 10100 RABE DRIVE | 2 | | 10221 SANDY DRIVE | 2 | | 10262 STRINGTOWN ROAD | 2 | | 110 EAST CHESTNUT | 2 | | 1ST AND CHESTNUT | 2 | | 202 WEST CHESTNUT | 2 | | 213 E CHESTNUT | 2 | | 213 EAST CHESTNUT | 2 | | 215 SOUTH THIRD | 2 | | 309 NORTH SECOND | 2 | | 313 NORTH FIRST | 2 | | 313 NORTH FIRST STREET | 2 |
| | | Fire incidents reported |
|---|
| Sreet name | Count |
|---|
| 412 SOUTH FIFTH | 2 | | 413 WEST CHESTNUT | 2 | | 603 NORTH FIFTH | 2 | | 604 NORTH FIFTH | 2 | | 604 WEST MYRTLE | 2 | | 606 SOUTH FIFTH | 2 | | 7029 STATE RT. 154 | 2 | | 7280 BARRY ROAD | 2 | | 7315 OKAW STREET | 2 | | 7325 KASKASKIA ST | 2 | | 7341 STATE RT 154 | 2 | | 7730 STATE RT 154 | 2 | | 7792 W. SPRINGVIEW | 2 | | 8058 WOODED OAK LANE | 2 | | 8060 WIRTH LANE | 2 | | 8155 COUNTY ROAD 18 | 2 | | 8700 COUNTY ROAD 18 | 2 | | 8792 STATE RT 154 | 2 | | 8792 STATE RT154 | 2 | | 8836 RIDGE ROAD | 2 | | 8950 STATE RT. 154 | 2 | | 9007 BALDWN RD. | 2 | | 901 WEST MYRTLE | 2 | | 901 WEST MYRTLE | 2 | | |
|
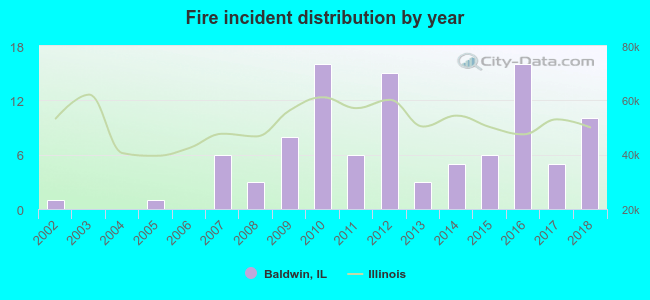 According to the data from the years 2002 - 2018 the average number of fire incidents per year is 6. The highest number of reported fires - 16 took place in 2010, and the least - 0 in 2003. The data has a rising trend.
 26.7% incidents where reported in the morning and 73.3% in the evening. The most fires (21.8%) took place on Friday, and the least (10.9%) on Tuesday.
 Based on the 101 fire incident reports from years 2002 - 2018 most fires (15.8%) took place during March, and the least (2.0%) in May.
 Out of all 136 cases reported during the years 2002 - 2018, the most belonged to the categories: Fire (74.3%), Rescue & EMS (6.6%), and Overpressure Rupture (5.9%).
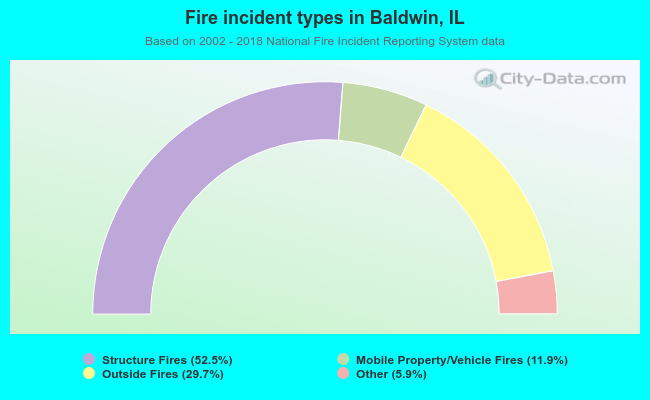 When looking into fire subcategories, the most reports belonged to: Structure Fires (52.5%), and Outside Fires (29.7%).