| Fire incidents reported |
|---|
| Sreet name | Count |
|---|
| RIVER RD | 94 | | AMOSITE RD | 34 | | RISSER RD | 32 | | BLACK SWAMP RD | 28 | | KEENER RD | 28 | | SECOND ST | 28 | | VINTAGE DR | 22 | | 2ND ST | 18 | | LOCUST GROVE RD | 14 | | WICKERSHAM RD | 14 | | CHESTNUT ST | 12 | | STACKSTOWN RD | 12 | | STONE MILL DR | 12 | | TURNPIKE RD | 12 | | BAINBRIDGE RD | 10 | | FALMOUTH RD | 10 | | LOCUST ST | 10 | | COMMODORE DR | 8 | | BAIR RD | 6 | | BECKER RD | 6 | | BLACK SWAMP RD | 6 | | GOVERNOR STABLE RD | 6 | | MARKET ST | 6 | | RACE ST | 6 | | SHUMAKER RD | 6 |
| | | Fire incidents reported |
|---|
| Sreet name | Count |
|---|
| ENGLE RD | 4 | | FRONT ST | 4 | | KISSEL BARRICK RD | 4 | | LOCUST GROVE RD RD | 4 | | MEADOW VIEW LN | 4 | | RETHERFORD DR | 4 | | STONEMILL DR | 4 | | TRAP ALY | 4 | | YODER RD | 4 | | 1251 AMOSITE RD | 2 | | 2ND ST | 2 | | BAINBRIDGE ROAD RD | 2 | | BOSSLER RD | 2 | | BUTTONWOOD DR | 2 | | CHESTNUT STREET ST | 2 | | CONOY CIR | 2 | | COVERED BRIDGE RD | 2 | | GOVERNAL STABLE RD | 2 | | HILL ST | 2 | | NEWBERRY RD | 2 | | NISSLEY RD | 2 | | OAK DR | 2 | | OVERLOOK DR | 2 | | PRESCOTT RD | 2 | | |
|
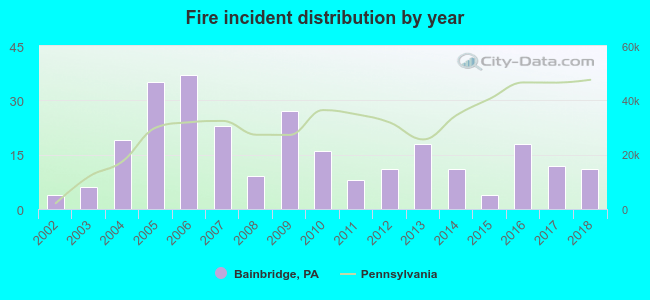 Based on the data from the years 2002 - 2018 the average number of fires per year is 16. The highest number of reported fires - 37 took place in 2006, and the least - 4 in 2002. The data has a rising trend.
 30.5% incidents where reported in the morning and 69.5% in the evening. The most fires (17.1%) took place on Thursday, and the least (9.3%) on Monday.
 Based on the 269 reports from years 2002 - 2018 most fires (20.4%) took place during January, and the least (2.6%) in July.
 Out of all 578 cases reported during the years 2002 - 2018, the most belonged to the categories: Fire (46.5%), Hazardous Condition (14.4%), and Rescue & EMS (13.5%).
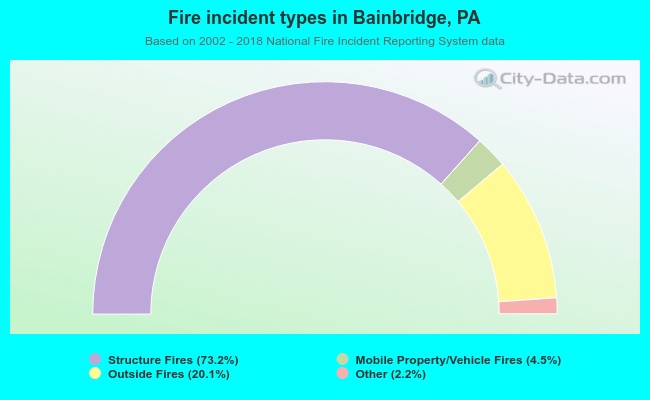 When looking into fire subcategories, the most incidents belonged to: Structure Fires (73.2%), and Outside Fires (20.1%).