Baden: Fire Incidents, Pennsylvania (PA)
Where are fire incidents reported in Baden, PA
Something went wrong! Please refresh the page.
|
| |||||||||||||||||||||||||||||||||||||||||||||||||||||||||||||||||||||||||||||||||||||||||||||||||||||||||||||
2004 - 2018 National Fire Incident Reporting System (NFIRS) incidents
- Incident types reported to NFIRS in Baden, PA
- 52649.1%Fire
- 25123.4%Hazardous Condition
- 969.0%Rescue & EMS
- 757.0%False Alarm
- 565.2%Good Intent Call
- 454.2%Service Call
- 121.1%Special Incident
- 70.7%Severe Weather
- 30.3%Overpressure Rupture
- Fire incident types reported to NFIRS in Baden, PA
- 40877.6%Structure Fires
- 468.7%Other
- 387.2%Outside Fires
- 346.5%Mobile Property/Vehicle Fires
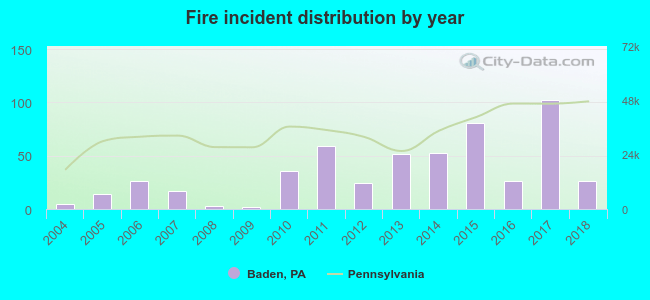 Based on the data from the years 2004 - 2018 the average number of fires per year is 35. The highest number of reported fires - 102 took place in 2017, and the least - 2 in 2009. The data has a rising trend.
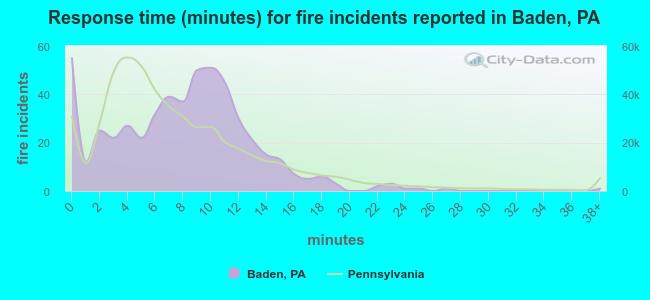 The median response time based on all reported fire incidents is 8 minutes. This is higher compared to the Pennsylvania median value.
The median response time in Baden, PA compared to nearest cities:
(Note: Based on data for all years, including only cities with at least 500 fire incidents)
| Baden: | 8 minutes |
| Aliquippa: | 7 minutes |
| Ambridge: | 5 minutes |
| Rochester: | 7 minutes |
| New Brighton: | 8 minutes |
| Beaver Falls: | 5 minutes |
| Gibsonia: | 9 minutes |
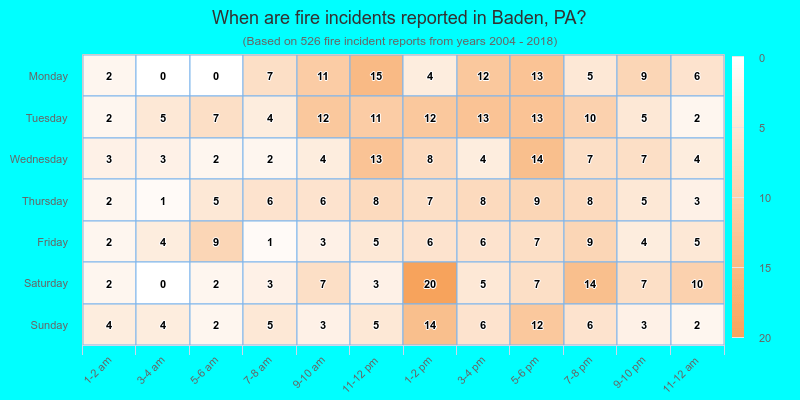
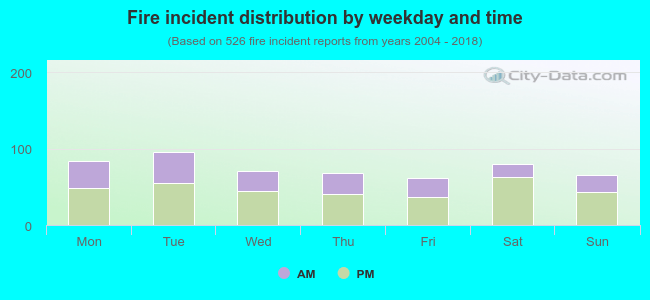 37.1% incidents where reported in the morning and 62.9% in the evening. The most fires (18.3%) took place on Tuesday, and the least (11.6%) on Friday.
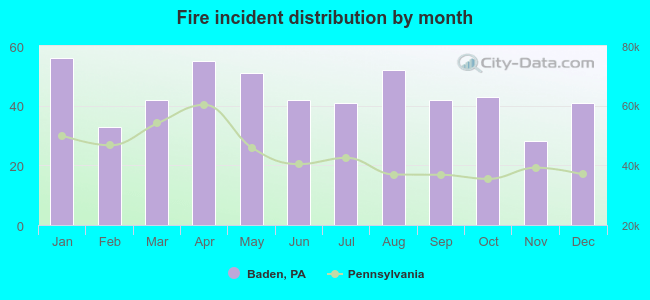 Based on the 526 fires from years 2004 - 2018 most fires (10.6%) took place during January, and the least (5.3%) in November.
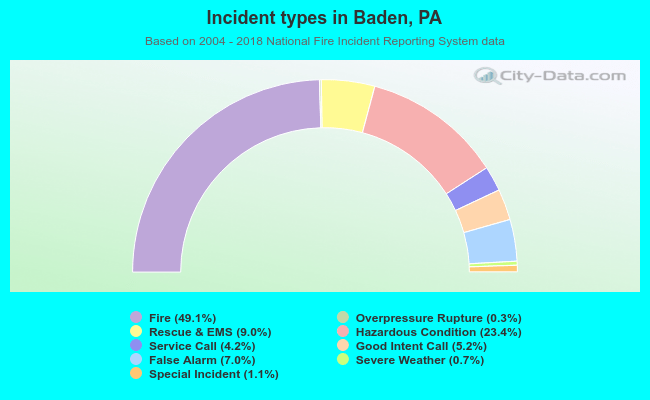 Out of all 1,071 cases reported during the years 2004 - 2018, the most belonged to the categories: Fire (49.1%), Hazardous Condition (23.4%), and Rescue & EMS (9.0%).
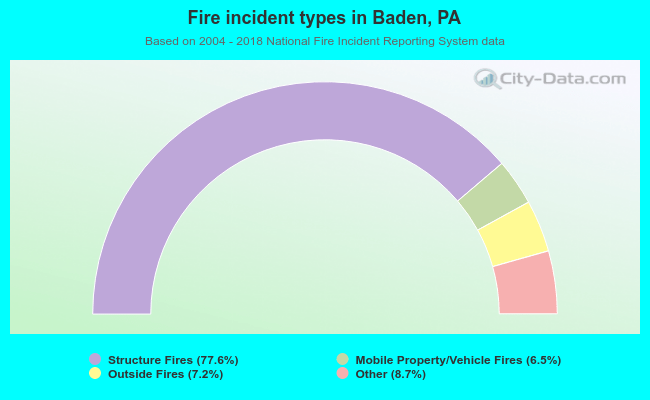 When looking into fire subcategories, the most reports belonged to: Structure Fires (77.6%), and Other (8.7%).