Bad Axe: Fire Incidents, Michigan (MI)
Where are fire incidents reported in Bad Axe, MI
Something went wrong! Please refresh the page.
|
| |||||||||||||||||||||||||||||||||||||||||||||||||||||||||||||||||||||||||||||||||||||||||||||||||||||||||||||
2002 - 2018 National Fire Incident Reporting System (NFIRS) incidents
- Incident types reported to NFIRS in Bad Axe, MI
- 42442.4%Fire
- 28428.4%Hazardous Condition
- 16916.9%Rescue & EMS
- 555.5%False Alarm
- 333.3%Service Call
- 292.9%Good Intent Call
- 50.5%Special Incident
- Fire incident types reported to NFIRS in Bad Axe, MI
- 15536.6%Outside Fires
- 14834.9%Structure Fires
- 7918.6%Mobile Property/Vehicle Fires
- 429.9%Other
 Based on the data from the years 2002 - 2018 the average number of fire incidents per year is 25. The highest number of reported fire incidents - 37 took place in 2010, and the least - 11 in 2013. The data has a rising trend.
 26.2% incidents where reported in the morning and 73.8% in the evening. The most fires (15.8%) took place on Monday, and the least (11.8%) on Tuesday.
 Based on the 424 fires from years 2002 - 2018 most fires (14.4%) took place during April, and the least (3.5%) in December.
 Out of all 1,001 cases reported during the years 2002 - 2018, the most belonged to the categories: Fire (42.4%), Hazardous Condition (28.4%), and Rescue & EMS (16.9%).
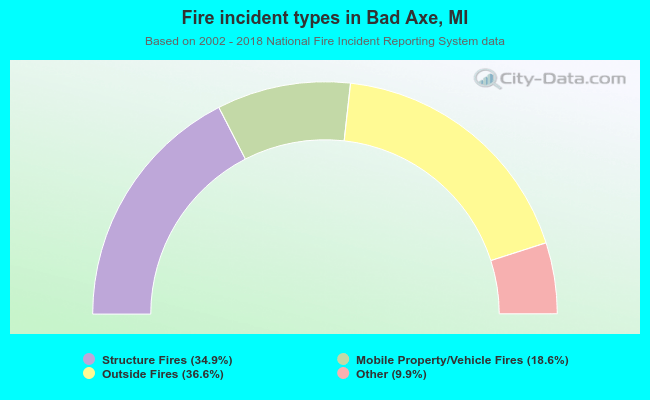 When looking into fire subcategories, the most reports belonged to: Outside Fires (36.6%), and Structure Fires (34.9%).