| Fire incidents reported |
|---|
| Sreet name | Count |
|---|
| SCOTT RD | 32 | | HIGHWAY 21 | 16 | | NORTH DR | 16 | | COUNTY RD 904 | 10 | | ELM BLVD | 10 | | HWY 21 | 10 | | VIRGINIA ELY RD | 10 | | 112 FOREST ROAD | 8 | | BASSWOOD CIR | 8 | | COMMERCE RD | 8 | | ESCAPE RD | 8 | | HIGHWAY 70 | 8 | | NORTHSHORE MINING | 8 | | SOUTH DR | 8 | | CENTRAL BLVD | 6 | | HEMLOCK CIR | 6 | | TIMBER BAY RD | 6 | | ASH BLVD | 4 | | BEAR ISLAND CABIN DR | 4 | | BEAR ISLAND RESORT RD | 4 | | BEAR ISLAND RIVER RD | 4 | | BIRCH BLVD | 4 | | BIRCH LAKE | 4 | | CEDAR DR | 4 | | CONSERVATION RD | 4 |
| | | Fire incidents reported |
|---|
| Sreet name | Count |
|---|
| HAAPALA RD | 4 | | HWY 70 | 4 | | JOSEPH ST | 4 | | PLANTATION RD | 4 | | SPRINGRIDGE RD | 4 | | TERRANCE ST | 4 | | TOWNSHIP ROAD 6303 | 4 | | WAHLSTEN RD | 4 | | 1ST AVE | 2 | | 34 BIRCH | 2 | | 3RD AVE | 2 | | 583 RD | 2 | | 8319 JOSEPH STREET | 2 | | 904 HWY | 2 | | ASPEN LANE | 2 | | BALSAM CIR | 2 | | BEAR ISLAND CABIN DR | 2 | | BEAR ISLAND CABIN DRIVE | 2 | | BEAR ISLAND LAKE RD | 2 | | BEAR ISLAND RESORT RD | 2 | | BEAR TOOTH RD | 2 | | BIRCH LAKE RD | 2 | | BIRCH LK. TIMBER BAY RD. RD | 2 | | BIRCH RIVER RD | 2 | | |
|
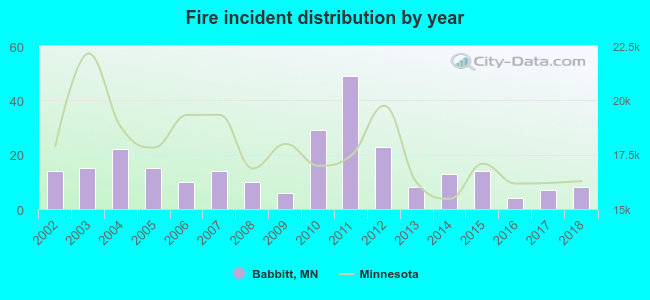 Based on the data from the years 2002 - 2018 the average number of fire incidents per year is 15. The highest number of fires - 49 took place in 2011, and the least - 4 in 2016. The data has a decreasing trend.
 32.6% incidents where reported in the morning and 67.4% in the evening. The most fires (17.6%) took place on Saturday, and the least (12.6%) on Wednesday.
 According to the 261 fire incident reports from years 2002 - 2018 most fires (16.5%) took place during April, and the least (5.0%) in January.
 Out of all 460 cases reported during the years 2002 - 2018, the most belonged to the categories: Fire (56.7%), Hazardous Condition (15.4%), and Rescue & EMS (13.9%).
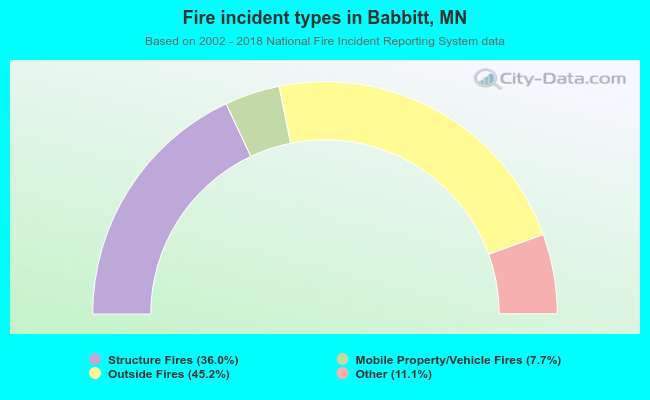 When looking into fire subcategories, the most incidents belonged to: Outside Fires (45.2%), and Structure Fires (36.0%).