Avondale: Fire Incidents, Pennsylvania (PA)
Where are fire incidents reported in Avondale, PA
Something went wrong! Please refresh the page.
|
| |||||||||||||||||||||||||||||||||||||||||||||||||||||||||||||||||||||||||||||||||||||||||||||||||||||||||||||
2003 - 2018 National Fire Incident Reporting System (NFIRS) incidents
- Incident types reported to NFIRS in Avondale, PA
- 69929.0%Fire
- 51921.5%Rescue & EMS
- 36515.2%Hazardous Condition
- 28812.0%False Alarm
- 27511.4%Service Call
- 26010.8%Good Intent Call
- Fire incident types reported to NFIRS in Avondale, PA
- 30844.1%Structure Fires
- 22231.8%Outside Fires
- 9814.0%Mobile Property/Vehicle Fires
- 7110.2%Other
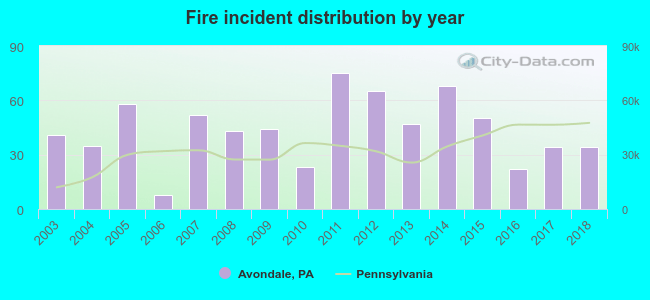 Based on the data from the years 2003 - 2018 the average number of fire incidents per year is 44. The highest number of fires - 75 took place in 2011, and the least - 8 in 2006. The data has a dropping trend.
 The median response time based on all reported fire incidents is 9 minutes. This is higher than the state median value.
The median response time in Avondale, PA compared to nearest cities:
(Note: Based on data for all years, including only cities with at least 500 fire incidents)
| Avondale: | 9 minutes |
| Kennett Square: | 8 minutes |
| Hockessin: | 8 minutes |
| Newark: | 8 minutes |
| Oxford: | 10 minutes |
| Coatesville: | 5 minutes |
| Parkesburg: | 9 minutes |
| Downingtown: | 8 minutes |
| West Chester: | 8 minutes |
 33.5% incidents where reported in the morning and 66.5% in the evening. The most fires (16.3%) took place on Tuesday, and the least (11.4%) on Wednesday.
 According to the 699 incident reports from years 2003 - 2018 most fires (11.6%) took place during June, and the least (4.4%) in December.
 Out of all 2,409 cases reported during the years 2003 - 2018, the most belonged to the categories: Fire (29.0%), Overpressure Rupture (21.5%), and Rescue & EMS (15.2%).
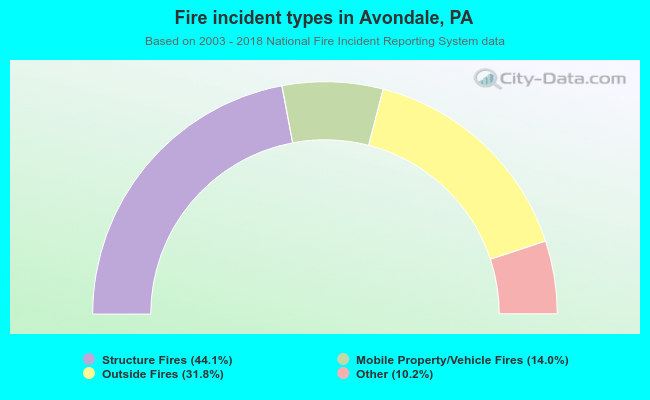 When looking into fire subcategories, the most reports belonged to: Structure Fires (44.1%), and Outside Fires (31.8%).