Aurora: Fire Incidents, Indiana (IN)
Where are fire incidents reported in Aurora, IN
Something went wrong! Please refresh the page.
|
| |||||||||||||||||||||||||||||||||||||||||||||||||||||||||||||||||||||||||||||||||||||||||||||||||||||||||||||
2002 - 2017 National Fire Incident Reporting System (NFIRS) incidents
- Incident types reported to NFIRS in Aurora, IN
- 71831.2%Rescue & EMS
- 60026.1%Hazardous Condition
- 46620.3%Fire
- 27712.0%Service Call
- 1145.0%Good Intent Call
- 813.5%False Alarm
- 311.3%Severe Weather
- 80.3%Special Incident
- 50.2%Overpressure Rupture
- Fire incident types reported to NFIRS in Aurora, IN
- 25955.6%Structure Fires
- 12727.3%Outside Fires
- 439.2%Mobile Property/Vehicle Fires
- 377.9%Other
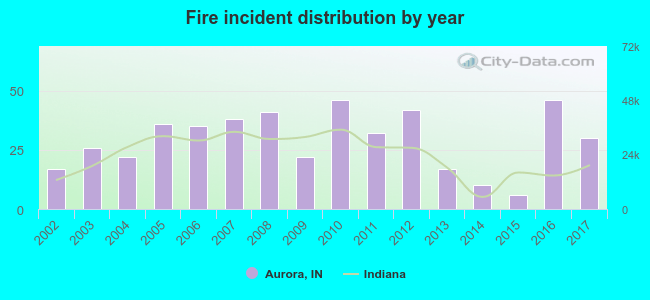 According to the data from the years 2002 - 2017 the average number of fires per year is 29. The highest number of reported fire incidents - 46 took place in 2010, and the least - 6 in 2015. The data has an increasing trend.
 36.1% incidents where reported in the morning and 63.9% in the evening. The most fires (16.7%) took place on Sunday, and the least (12.2%) on Monday.
 Based on the 466 fire incidents from years 2002 - 2017 most fires (12.2%) took place during March, and the least (6.4%) in November.
 Out of all 2,300 cases reported during the years 2002 - 2017, the most belonged to the categories: Rescue & EMS (31.2%), Hazardous Condition (26.1%), and Fire (20.3%).
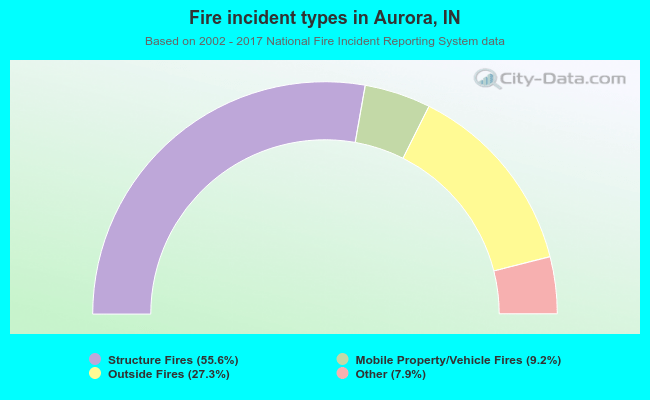 When looking into fire subcategories, the most reports belonged to: Structure Fires (55.6%), and Outside Fires (27.3%).