| Fire incidents reported |
|---|
| Sreet name | Count |
|---|
| M-32 WEST | 14 | | M-33 NORTH | 14 | | M32 | 12 | | M33 SOUTH | 12 | | M-32 EAST | 10 | | M-33 | 10 | | COUNTY ROAD 487 | 8 | | COUNTY ROAD 489 | 8 | | M-33 SOUTH | 8 | | BAKER ROAD | 6 | | CO RD 487 | 6 | | LAKE 15 ROAD | 6 | | M-32 | 6 | | M33 | 6 | | MERIDIAN LINE ROAD | 6 | | 10770 BAKER ROAD | 4 | | 11344 PARLAND STREET | 4 | | 9265 HALL ROAD | 4 | | 9820 BIG PINE STREET | 4 | | AIRPORT ROAD | 4 | | CARTER ROAD | 4 | | CO ROAD 487 | 4 | | DEFORGE ROAD | 4 | | GREEN VALLEY TRL | 4 | | KELLYVILLE ROAD | 4 |
| | | Fire incidents reported |
|---|
| Sreet name | Count |
|---|
| M33 NORTH | 4 | | MCSWAIN ROAD | 4 | | SMALLERS ROAD | 4 | | STATE STREET | 4 | | WILLIE B ROAD | 4 | | 10210 LAKEVIEW DRIVE | 2 | | 10220 RYAN ROAD | 2 | | 10280 KEEGO DRIVE | 2 | | 10315 M-32 WEST | 2 | | 10320 SOUTH AIRPORT ROAD | 2 | | 10425 HAMMOND DRIVE | 2 | | 10707 CULVER ROAD | 2 | | 10730 SOUTH AIRPORT ROAD | 2 | | 10811 RIVER RD. | 2 | | 10811 RIVER ROAD | 2 | | 10830 MOUCH ROAD | 2 | | 10926 DAMROSE DR | 2 | | 10939 MAPLE STREET | 2 | | 10971 EAST AIRPORT ROAD | 2 | | 10990 MOUCH ROAD | 2 | | 11060 RIVER ROAD | 2 | | 11089 MCARTHUR ROAD | 2 | | 11105 MCARTHUR ROAD | 2 | | 11301 MCARTHUR ROAD | 2 | | |
|
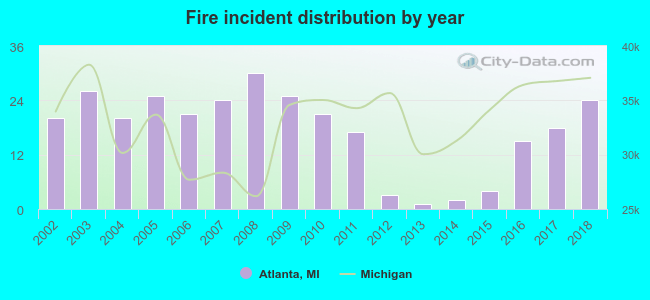 Based on the data from the years 2002 - 2018 the average number of fire incidents per year is 17. The highest number of reported fires - 30 took place in 2008, and the least - 1 in 2013. The data has a rising trend.
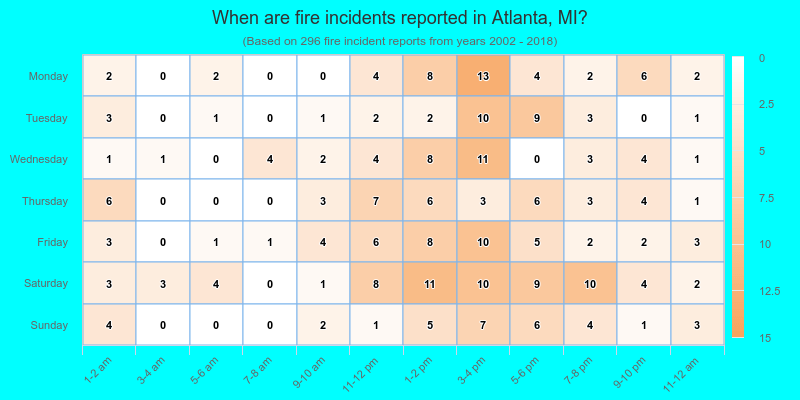
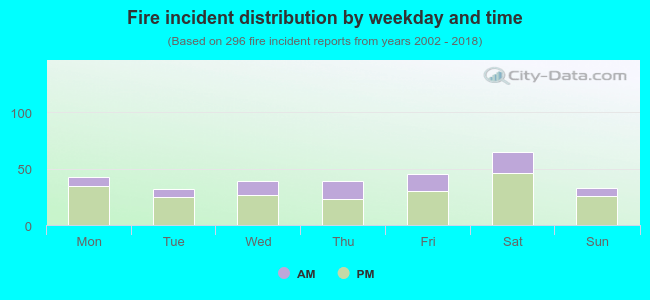 28.4% incidents where reported in the morning and 71.6% in the evening. The most fires (22.0%) took place on Saturday, and the least (10.8%) on Tuesday.
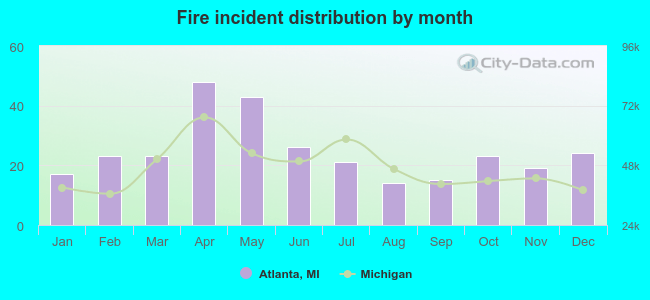 According to the 296 fire incident reports from years 2002 - 2018 most fires (16.2%) took place during April, and the least (4.7%) in August.
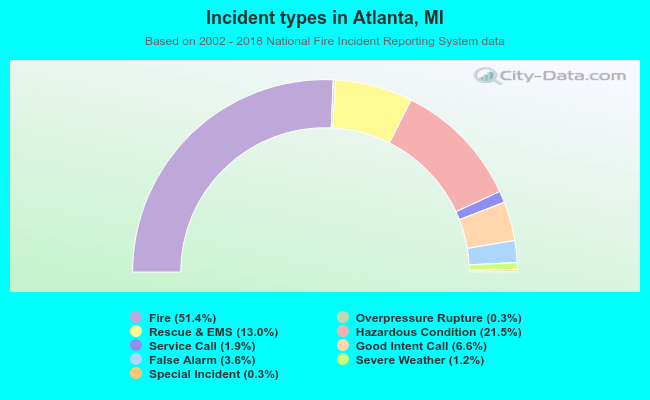 Out of all 576 cases reported during the years 2002 - 2018, the most belonged to the categories: Fire (51.4%), Hazardous Condition (21.5%), and Rescue & EMS (13.0%).
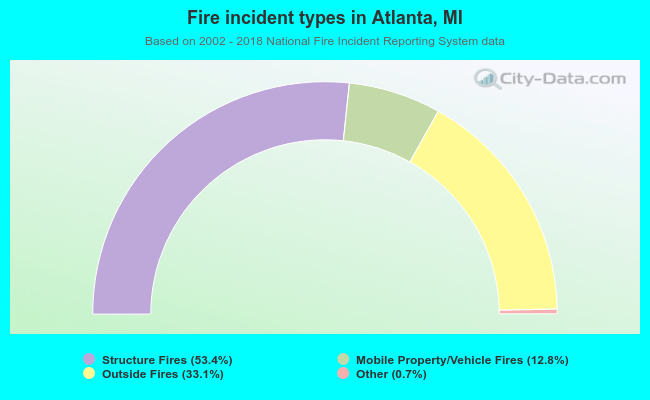 When looking into fire subcategories, the most reports belonged to: Structure Fires (53.4%), and Outside Fires (33.1%).