Atlanta: Fire Incidents, Illinois (IL)
Where are fire incidents reported in Atlanta, IL
Something went wrong! Please refresh the page.
|
| |||||||||||||||||||||||||||||||||||||||||||||||||||||||||||||||||||||||||||||||||||||||||||||||||||||||||||||
| Other | 68 | |||||||||||||||||||||||||||||||||||||||||||||||||||||||||||||||||||||||||||||||||||||||||||||||||||||||||||||
2002 - 2018 National Fire Incident Reporting System (NFIRS) incidents
- Incident types reported to NFIRS in Atlanta, IL
- 36043.0%Fire
- 20023.9%Rescue & EMS
- 16219.3%Good Intent Call
- 758.9%Hazardous Condition
- 202.4%Service Call
- 192.3%False Alarm
- 10.1%Severe Weather
- 10.1%Special Incident
- Fire incident types reported to NFIRS in Atlanta, IL
- 15643.3%Outside Fires
- 13838.3%Structure Fires
- 5515.3%Mobile Property/Vehicle Fires
- 113.1%Other
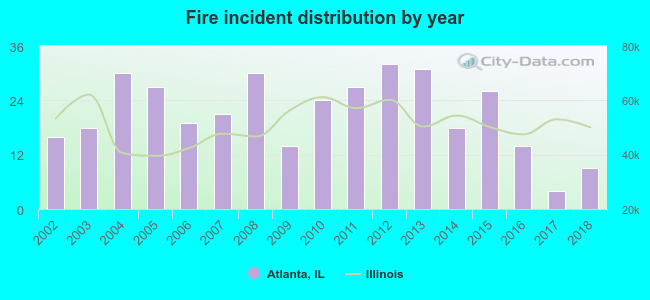 Based on the data from the years 2002 - 2018 the average number of fires per year is 21. The highest number of fire incidents - 32 took place in 2012, and the least - 4 in 2017. The data has a declining trend.
 32.5% incidents where reported in the morning and 67.5% in the evening. The most fires (17.8%) took place on Monday, and the least (11.1%) on Thursday.
 According to the 360 fire incident reports from years 2002 - 2018 most fires (14.2%) took place during June, and the least (2.5%) in December.
 Out of all 838 cases reported during the years 2002 - 2018, the most belonged to the categories: Fire (43.0%), Overpressure Rupture (23.9%), and Service Call (19.3%).
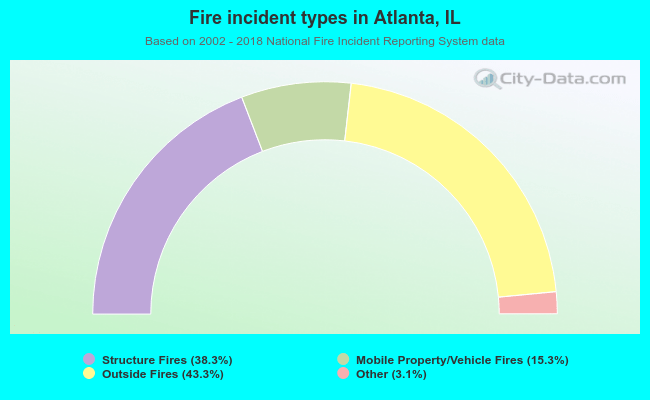 When looking into fire subcategories, the most reports belonged to: Outside Fires (43.3%), and Structure Fires (38.3%).