Astoria: Fire Incidents, Illinois (IL)
Where are fire incidents reported in Astoria, IL
Something went wrong! Please refresh the page.
|
| |||||||||||||||||||||||||||||||||||||||||||||||||||||||||||||||||||||||||||||||||||||||||||||||||||||||||||||
| Other | 10 | |||||||||||||||||||||||||||||||||||||||||||||||||||||||||||||||||||||||||||||||||||||||||||||||||||||||||||||
2002 - 2018 National Fire Incident Reporting System (NFIRS) incidents
- Incident types reported to NFIRS in Astoria, IL
- 32476.6%Fire
- 409.5%Hazardous Condition
- 235.4%Rescue & EMS
- 153.5%False Alarm
- 92.1%Good Intent Call
- 81.9%Service Call
- 40.9%Overpressure Rupture
- Fire incident types reported to NFIRS in Astoria, IL
- 15246.9%Structure Fires
- 12638.9%Outside Fires
- 257.7%Mobile Property/Vehicle Fires
- 216.5%Other
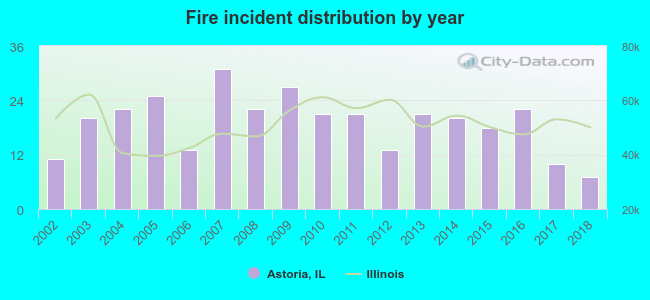 Based on the data from the years 2002 - 2018 the average number of fires per year is 19. The highest number of fire incidents - 31 took place in 2007, and the least - 7 in 2018. The data has a declining trend.
 According to the data from the years 2002 - 2018 the average number of fire-related yearly casualties is 0. The highest number of injuries - 2 took place in 2003, and the lowest - 0 in 2004. The data has a decreasing trend.
 32.1% incidents where reported in the morning and 67.9% in the evening. The most fires (17.6%) took place on Saturday, and the least (9.3%) on Friday.
 Based on the 324 incident reports from years 2002 - 2018 most fires (18.5%) took place during March, and the least (3.4%) in June.
 Out of all 423 cases reported during the years 2002 - 2018, the most belonged to the categories: Fire (76.6%), Hazardous Condition (9.5%), and Rescue & EMS (5.4%).
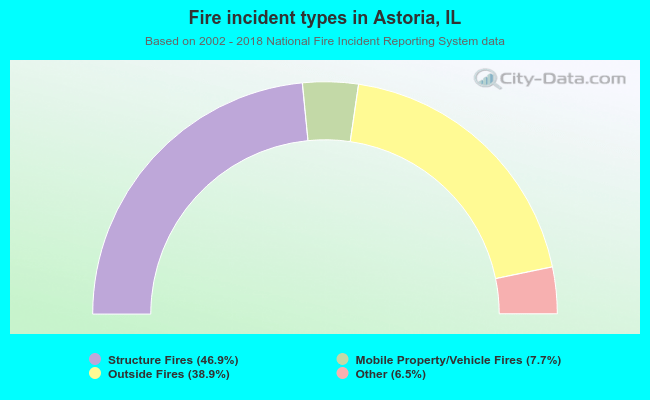 When looking into fire subcategories, the most incidents belonged to: Structure Fires (46.9%), and Outside Fires (38.9%).