Ash Flat: Fire Incidents, Arkansas (AR)
Where are fire incidents reported in Ash Flat, AR
Something went wrong! Please refresh the page.
|
| |||||||||||||||||||||||||||||||||||||||||||||||||||||||||||||||||||||||||||||||||||||||||||||||||||||||||||||
2002 - 2018 National Fire Incident Reporting System (NFIRS) incidents
- Incident types reported to NFIRS in Ash Flat, AR
- 1,29352.9%Rescue & EMS
- 60924.9%Fire
- 26610.9%Service Call
- 1616.6%Good Intent Call
- 652.7%False Alarm
- 441.8%Hazardous Condition
- 30.1%Severe Weather
- 30.1%Special Incident
- Fire incident types reported to NFIRS in Ash Flat, AR
- 39564.9%Outside Fires
- 11819.4%Structure Fires
- 6510.7%Mobile Property/Vehicle Fires
- 315.1%Other
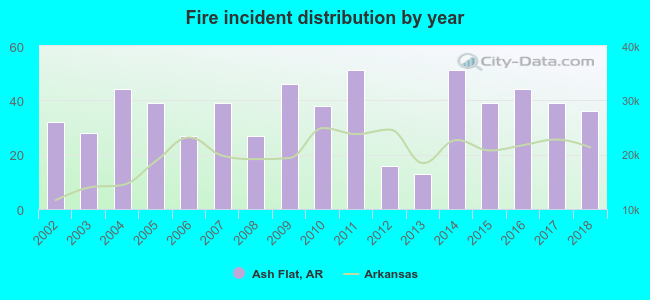 Based on the data from the years 2002 - 2018 the average number of fires per year is 36. The highest number of fires - 51 took place in 2011, and the least - 13 in 2013. The data has an increasing trend.
 The median response time based on all reported fire incidents is 6 minutes. This is similar to the Arkansas median value.
The median response time in Ash Flat, AR compared to nearest cities:
(Note: Based on data for all years, including only cities with at least 500 fire incidents)
| Ash Flat: | 6 minutes |
| Cherokee Village: | 5 minutes |
| Hardy: | 10 minutes |
| Cave City: | 7 minutes |
| Melbourne: | 10 minutes |
| Viola: | 10 minutes |
| Batesville: | 4 minutes |
| Pocahontas: | 5 minutes |
| Hoxie: | 6 minutes |
 According to the data from the years 2002 - 2018 the average number of fire-related yearly deaths is 0. The highest number of reported deaths - 1 took place in 2009, and the lowest - 0 in 2002. The data has a constant trend.
 24.6% incidents where reported in the morning and 75.4% in the evening. The most fires (17.6%) took place on Saturday, and the least (11.5%) on Thursday.
 According to the 609 fires from years 2002 - 2018 most fires (23.0%) took place during March, and the least (3.4%) in September.
 Out of all 2,444 cases reported during the years 2002 - 2018, the most belonged to the categories: Overpressure Rupture (52.9%), Fire (24.9%), and Hazardous Condition (10.9%).
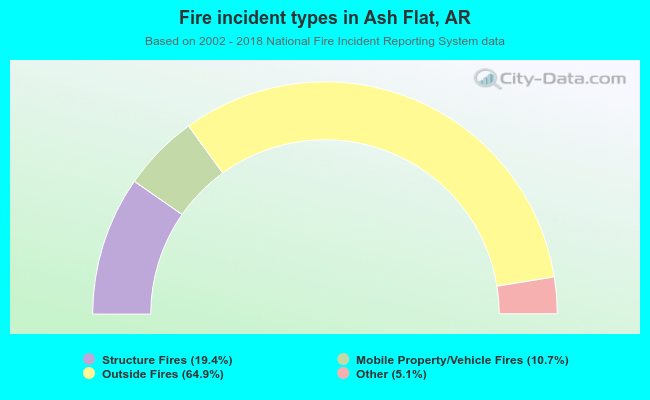 When looking into fire subcategories, the most incidents belonged to: Outside Fires (64.9%), and Structure Fires (19.4%).