| Fire incidents reported |
|---|
| Sreet name | Count |
|---|
| 1 ASHLEY WAY WAY | 12 | | MAIN ST | 10 | | RIVER VALLEY RD | 10 | | 1080 NORTH 3RD STREET ST | 6 | | 95 HWY | 6 | | BURLINGTON RD | 6 | | HOLCOMBE COULEE | 6 | | 93 HWY | 4 | | CLEVELAND STREET ST | 4 | | CODDIE KLINK RD | 4 | | COUNTY ROAD J RD | 4 | | FIMIAN RD | 4 | | HAINES LN | 4 | | HWY 95 | 4 | | N22964 KUKOWSKI LANE | 4 | | N27776 SHAY LN | 4 | | NORTH 3RD STREET ST | 4 | | NORTH CREEK RD | 4 | | ONE ASHLEY WAY WAY | 4 | | RIVER STREET ST | 4 | | RIVER VALLEY RD | 4 | | STH 93 | 4 | | W27828 COUNTY ROAD A RD | 4 | | 1011 EAST MAIN STREET ST | 2 | | 105 WEST MAIN RD | 2 |
| | | Fire incidents reported |
|---|
| Sreet name | Count |
|---|
| 107 EAST MAIN STREET ST | 2 | | 1240 MIDDLE RD | 2 | | 125 WEST MAIN STREET ST | 2 | | 126 WEST MAIN STREET ST | 2 | | 130 SOUTH OAK STREET ST | 2 | | 1362 EAST MAIN STREET ST | 2 | | 1385 EAST WILSON AVENUE AVE | 2 | | 1385 EAST WILSON ST | 2 | | 1385 EAST WILSON STREET ST | 2 | | 1450 EAST WILSON AVENUE AVE | 2 | | 1488 EAST HALVERSON LANE ST | 2 | | 1575 EAST BLASHKO STREET ST | 2 | | 206 SOUTH ST JOSEPHS AVENUE AVE | 2 | | 206 SOUTH ST. JOSEPHS AVENUE AVE | 2 | | 209 NORTH 3RD STREET ST | 2 | | 215 ST JOSEPH AVENUE AVE | 2 | | 219 GILLESPIE AVENUE AVE | 2 | | 220 GREEN BAY AVENUE AVE | 2 | | 233 GILLESPIE STREET ST | 2 | | 233 NORTH OAK STREET ST | 2 | | 236 NORTH THIRD STREET ST | 2 | | 243 NORTH 3RD STREET ST | 2 | | 26588 JOE ROSSA LN | 2 | | 308 SOUTH WASHINGTON ST | 2 | | |
|
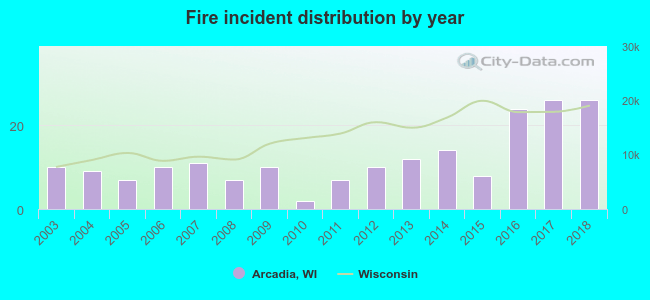 Based on the data from the years 2003 - 2018 the average number of fire incidents per year is 12. The highest number of reported fires - 26 took place in 2017, and the least - 2 in 2010. The data has a rising trend.
 39.9% incidents where reported in the morning and 60.1% in the evening. The most fires (21.8%) took place on Saturday, and the least (7.3%) on Thursday.
 According to the 193 fire incidents from years 2003 - 2018 most fires (15.0%) took place during March, and the least (2.1%) in July.
 Out of all 433 cases reported during the years 2003 - 2018, the most belonged to the categories: Fire (44.6%), Overpressure Rupture (24.2%), and Rescue & EMS (18.5%).
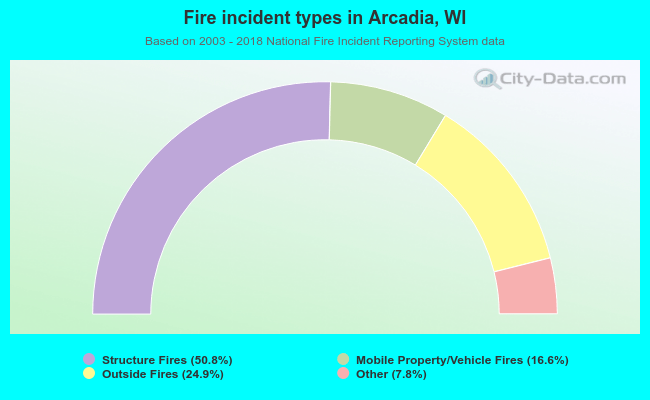 When looking into fire subcategories, the most reports belonged to: Structure Fires (50.8%), and Outside Fires (24.9%).