| Fire incidents reported |
|---|
| Sreet name | Count |
|---|
| SCOUT CAMP RD | 26 | | STAGECOACH RD | 26 | | STAGECOACH TRL | 14 | | BROADWAY RD | 12 | | HODGIN RD | 10 | | STAGECOACH TRAIL TRL | 8 | | WEBSTER ST | 8 | | CANYON PARK RD | 6 | | CANYON RD | 6 | | CHESTNUT ST | 6 | | HACKER RD | 6 | | HICKORY ST | 6 | | SCHAPVILLE RD | 6 | | SCOUT CAMP | 6 | | SCOUTCAMP RD | 6 | | WALNUT ST | 6 | | 2ND NORTH ST | 4 | | COTTONWOOD CT | 4 | | COUNTY W | 4 | | MAPLE | 4 | | RAILROAD ST | 4 | | RED SAIL CT | 4 | | SALEM RD | 4 | | TWIN BRIDGES RD | 4 | | AND RAILROOM RD | 2 |
| | | Fire incidents reported |
|---|
| Sreet name | Count |
|---|
| APPLE CANYON LAKE RD | 2 | | APPLE CANYON RD | 2 | | APPLE CANYON ROAD | 2 | | BLACKHAWK LN | 2 | | BOURQUIN RD | 2 | | CANYON | 2 | | CANYON AND CLARK DR | 2 | | CANYON PARK | 2 | | CARDINAL CT | 2 | | CHESTNUT | 2 | | COTTONWOOD | 2 | | COUNCIL FIRE | 2 | | COUNCIL FIRE CT | 2 | | COUNCIL FIRE DR | 2 | | COUNCIL FIRE ST | 2 | | DIMICK RD | 2 | | DIMINCK RD | 2 | | DOTZEL RD | 2 | | ELIZABETH SCALES MOUND R. | 2 | | FAIR OAK COURT | 2 | | FAIR OAKS CT | 2 | | FAIROAKS CT | 2 | | GABEL LN | 2 | | GENERAL SHERMAN CT | 2 | | HAMMER RD | 2 |
|
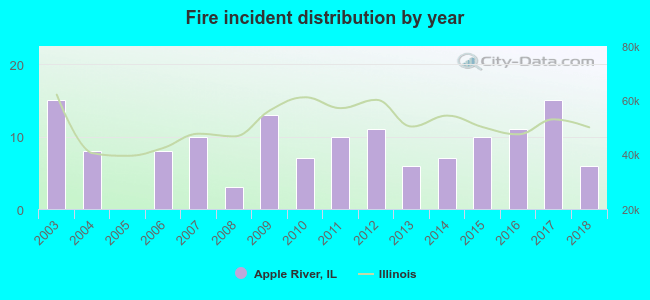 According to the data from the years 2003 - 2018 the average number of fire incidents per year is 9. The highest number of reported fire incidents - 15 took place in 2003, and the least - 0 in 2005. The data has a decreasing trend.
 25.0% incidents where reported in the morning and 75.0% in the evening. The most fires (20.0%) took place on Friday, and the least (9.3%) on Sunday.
 Based on the 140 reports from years 2003 - 2018 most fires (25.7%) took place during April, and the least (3.6%) in August.
 Out of all 543 cases reported during the years 2003 - 2018, the most belonged to the categories: Overpressure Rupture (56.5%), Fire (25.8%), and Rescue & EMS (6.1%).
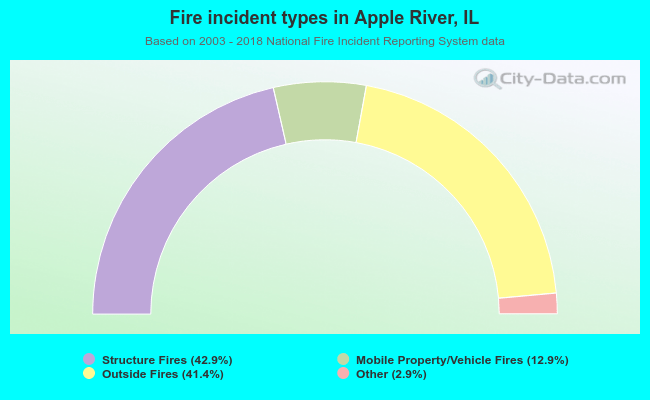 When looking into fire subcategories, the most incidents belonged to: Structure Fires (42.9%), and Outside Fires (41.4%).