| Fire incidents reported |
|---|
| Sreet name | Count |
|---|
| 98 HWY | 20 | | HWY 98 | 12 | | 14TH ST | 6 | | AIRPORT RD | 6 | | 5TH AND M ST | 4 | | BROWNSVILLE RD | 4 | | HIGHWAY 98 HWY | 4 | | KEVIN RD | 4 | | WATER ST | 4 | | #304 HERITAGE VILLAS | 2 | | 1 PINE DR | 2 | | 1047 ROSEMONT ST | 2 | | 1063 ROSEMONT | 2 | | 107 HATHCOCK RD | 2 | | 1081 PINEWOOD | 2 | | 109 N BAYSHORE DR | 2 | | 10TH & AVE I | 2 | | 10TH ST | 2 | | 1168 BLUFF RD | 2 | | 1215 12TH ST | 2 | | 122 SQUIRE RD | 2 | | 123 WATER ST | 2 | | 127 AVE J | 2 | | 12TH AND AVE L | 2 | | 12TH ST | 2 |
| | | Fire incidents reported |
|---|
| Sreet name | Count |
|---|
| 15 OAK DR | 2 | | 151 10TH - LOVE CENTER CHURCH | 2 | | 151 10TH STRE | 2 | | 1526 LINDIN RD | 2 | | 1561 PEACHTREE RD | 2 | | 157 13TH STREET | 2 | | 165 13TH | 2 | | 166 MANATEE WAY | 2 | | 17 GIBSON RD | 2 | | 175 25TH ST | 2 | | 180 22ND AVE | 2 | | 191 9TH STREET | 2 | | 2 MILE HWY 98 | 2 | | 200 JULE RD | 2 | | 200 JULIE RD | 2 | | 202 4TH | 2 | | 216 4TH ST | 2 | | 222 16TH ST. & AVENUE F ST | 2 | | 226 16TH ST & AVENUE F ST | 2 | | 23RD AVE | 2 | | 24 16TH ST | 2 | | 24 TH ST | 2 | | 254 9TH ST | 2 | | 277 TIMOTHY SIMMONS | 2 | | 295 26TH AVENUE | 2 |
|
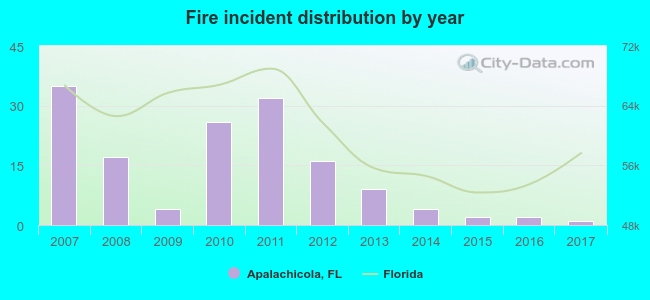 According to the data from the years 2007 - 2017 the average number of fire incidents per year is 13. The highest number of reported fire incidents - 35 took place in 2007, and the least - 1 in 2017. The data has a decreasing trend.
 48.6% incidents where reported in the morning and 51.4% in the evening. The most fires (19.6%) took place on Monday, and the least (11.5%) on Thursday.
 Based on the 148 reports from years 2007 - 2017 most fires (11.5%) took place during February, and the least (2.7%) in July.
 Out of all 961 cases reported during the years 2007 - 2017, the most belonged to the categories: Rescue & EMS (48.1%), Overpressure Rupture (28.9%), and Fire (15.4%).
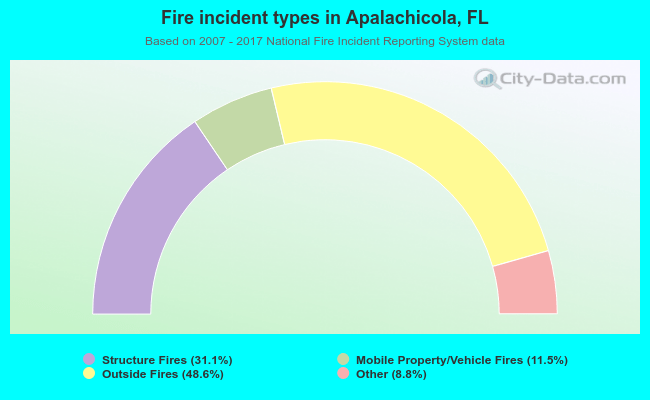 When looking into fire subcategories, the most reports belonged to: Outside Fires (48.6%), and Structure Fires (31.1%).