Amboy: Fire Incidents, Washington (WA)
Where are fire incidents reported in Amboy, WA
Something went wrong! Please refresh the page.
|
| |||||||||||||||||||||||||||||||||||||||||||||||||||||||||||||||||||||||||||||||||||||||||||||||||||||||||||||
2002 - 2018 National Fire Incident Reporting System (NFIRS) incidents
- Incident types reported to NFIRS in Amboy, WA
- 10256.4%Fire
- 3016.6%Good Intent Call
- 2413.3%Hazardous Condition
- 189.9%Service Call
- 63.3%Rescue & EMS
- 10.6%False Alarm
- Fire incident types reported to NFIRS in Amboy, WA
- 4241.2%Structure Fires
- 3736.3%Outside Fires
- 2120.6%Mobile Property/Vehicle Fires
- 22.0%Other
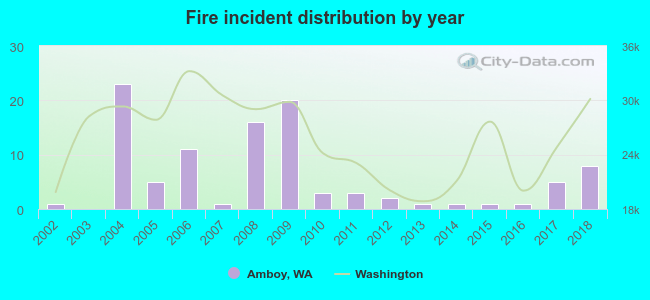 According to the data from the years 2002 - 2018 the average number of fire incidents per year is 6. The highest number of reported fire incidents - 23 took place in 2004, and the least - 0 in 2003. The data has an increasing trend.
 29.4% incidents where reported in the morning and 70.6% in the evening. The most fires (18.6%) took place on Wednesday, and the least (8.8%) on Tuesday.
 Based on the 102 reports from years 2002 - 2018 most fires (14.7%) took place during July, and the least (2.9%) in September.
 Out of all 181 cases reported during the years 2002 - 2018, the most belonged to the categories: Fire (56.4%), Service Call (16.6%), and Rescue & EMS (13.3%).
 When looking into fire subcategories, the most incidents belonged to: Structure Fires (41.2%), and Outside Fires (36.3%).