Alton: Fire Incidents, Illinois (IL)
Where are fire incidents reported in Alton, IL
Something went wrong! Please refresh the page.
| Fire incidents reported | |
|---|---|
| Sreet name | Count |
| WASHINGTON | 206 |
| BROADWAY | 200 |
| BROWN | 190 |
| COLLEGE | 130 |
| STATE | 124 |
| OAKWOOD | 100 |
| 6 TH ST | 94 |
| H A P | 92 |
| ALBY | 90 |
| 7 TH ST | 88 |
| CENTRAL | 88 |
| MAIN | 74 |
| BELLE | 70 |
| MILTON | 64 |
| HENRY | 58 |
| MANOR | 52 |
| 9 TH ST | 48 |
| CUT | 46 |
| PIASA | 44 |
| SALU | 44 |
| HIGHLAND | 42 |
| SEMINARY | 42 |
| ELM ST | 40 |
| MARIAN HEIGHTS | 40 |
| PARK | 40 |
| SANFORD | 40 |
| HOMER ADAMS PARKWAY | 38 |
| MADISON | 38 |
| HUMBERT | 36 |
| MARKET | 36 |
| Other | 995 |
2002 - 2018 National Fire Incident Reporting System (NFIRS) incidents
- Incident types reported to NFIRS in Alton, IL
- 16,35461.1%Rescue & EMS
- 3,28912.3%Fire
- 2,5149.4%Service Call
- 2,3198.7%Hazardous Condition
- 1,4275.3%False Alarm
- 8183.1%Good Intent Call
- 270.1%Severe Weather
- Fire incident types reported to NFIRS in Alton, IL
- 1,54547.0%Structure Fires
- 1,12634.2%Outside Fires
- 55616.9%Mobile Property/Vehicle Fires
- 621.9%Other
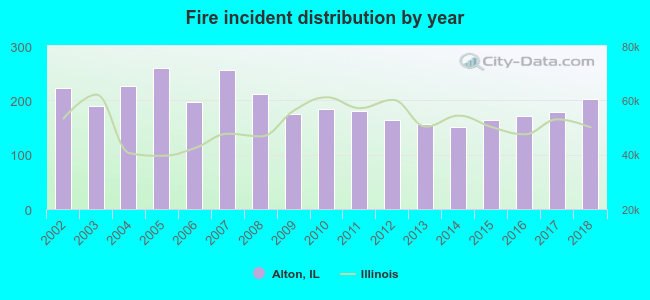 Based on the data from the years 2002 - 2018 the average number of fire incidents per year is 193. The highest number of reported fire incidents - 259 took place in 2005, and the least - 151 in 2014. The data has a decreasing trend.
The average number of yearly fire incidents per 10k residents in Alton, IL compared to nearest cities:
(Note: Based on data for the last 3 years, including only cities with population 5,000 and above)
| Alton: | 67.8 |
| East Alton: | 107.8 |
| Godfrey: | 39.2 |
| Wood River: | 55.0 |
| Bethalto: | 16.0 |
| Granite City: | 49.8 |
| Edwardsville: | 34.3 |
| Pontoon Beach: | 67.6 |
| Glen Carbon: | 17.8 |
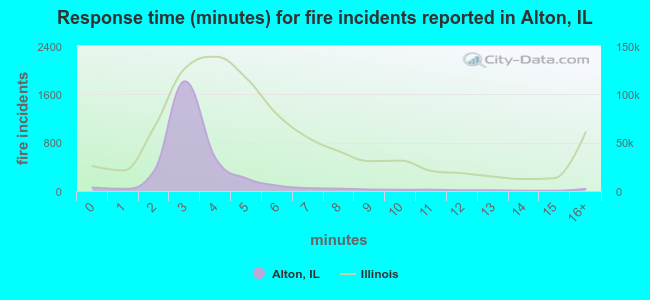 The median response time based on all reported fire incidents is 3 minutes. This is lower compared to the Illinois median value.
The median response time in Alton, IL compared to nearest cities:
(Note: Based on data for all years, including only cities with at least 500 fire incidents)
| Alton: | 3 minutes |
| East Alton: | 4 minutes |
| Godfrey: | 5 minutes |
| Wood River: | 4 minutes |
| Brighton: | 8 minutes |
| Granite City: | 3 minutes |
| Edwardsville: | 7 minutes |
| Pontoon Beach: | 7 minutes |
| Madison: | 6 minutes |
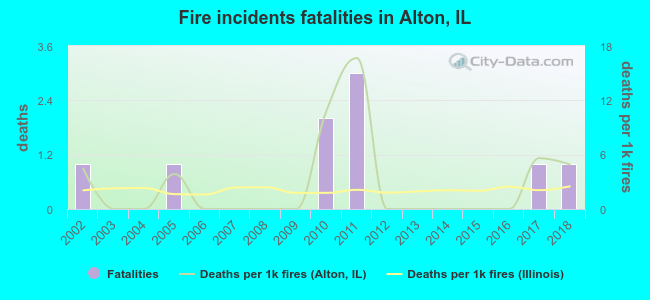 According to the reports from the years 2002 - 2018 the average number of fire-related yearly deaths is 1. The highest number of deaths - 3 took place in 2011, and the lowest - 0 in 2003. The data has a constant trend.
The average number of deaths per 1,000 fire incidents is 3. This indicator was the highest - 17 in 2011, and the lowest 0 in 2003. The trend for deaths per 1,000 incidents is growing. Compared to the state value the number of fatalities per 1,000 incidents is higher.
According to the reports from the years 2002 - 2018 the average number of fire-related yearly deaths is 1. The highest number of deaths - 3 took place in 2011, and the lowest - 0 in 2003. The data has a constant trend.
The average number of deaths per 1,000 fire incidents is 3. This indicator was the highest - 17 in 2011, and the lowest 0 in 2003. The trend for deaths per 1,000 incidents is growing. Compared to the state value the number of fatalities per 1,000 incidents is higher.Deaths per 1,000 incidents in Alton, IL compared to nearest cities:
(Note: Based on data for all years, including only cities with at least 2,500 fire incidents)
| Alton: | 2.7 |
| Granite City: | 2.0 |
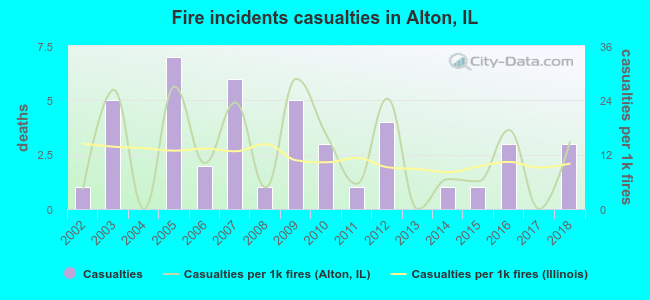 Based on the reports from the years 2002 - 2018 the average number of fire-related yearly casualties is 3. The highest number of reported casualties - 7 took place in 2005, and the lowest - 0 in 2004. The data has an increasing trend.
The average number of injuries per 1,000 fires is 13. This indicator was the highest - 29 in 2009, and the lowest 0 in 2004. The trend for casualties per 1,000 incidents is rising. Compared to the state value the number of injuries per 1,000 incidents is similar.
Based on the reports from the years 2002 - 2018 the average number of fire-related yearly casualties is 3. The highest number of reported casualties - 7 took place in 2005, and the lowest - 0 in 2004. The data has an increasing trend.
The average number of injuries per 1,000 fires is 13. This indicator was the highest - 29 in 2009, and the lowest 0 in 2004. The trend for casualties per 1,000 incidents is rising. Compared to the state value the number of injuries per 1,000 incidents is similar.Casualties per 1,000 incidents in Alton, IL compared to nearest cities:
(Note: Based on data for all years, including only cities with at least 500 fire incidents)
| Alton: | 13.1 |
| East Alton: | 22.3 |
| Godfrey: | 9.4 |
| Wood River: | 17.2 |
| Brighton: | 13.5 |
| Granite City: | 19.8 |
| Edwardsville: | 6.5 |
| Pontoon Beach: | 2.2 |
| Madison: | 2.0 |
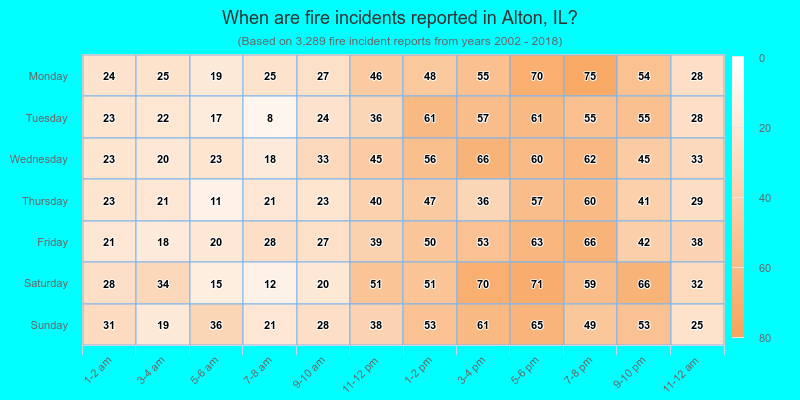
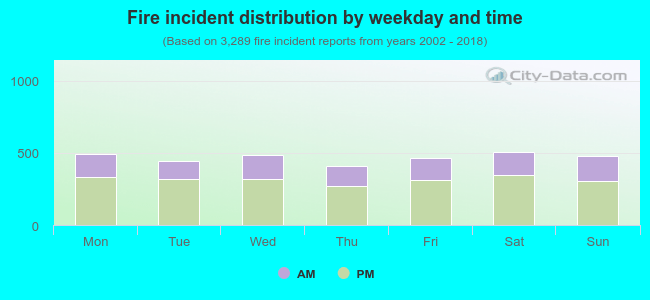 32.9% incidents where reported in the morning and 67.1% in the evening. The most fires (15.5%) took place on Saturday, and the least (12.4%) on Thursday.
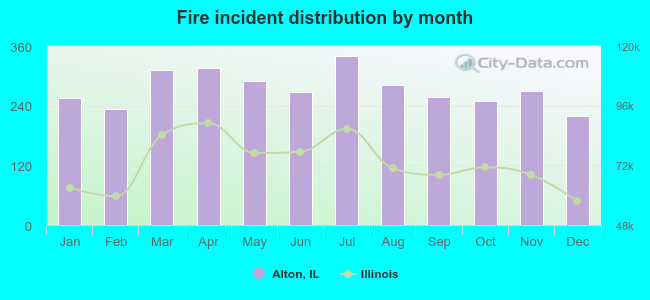 Based on the 3,289 fires from years 2002 - 2018 most fires (10.3%) took place during July, and the least (6.7%) in December.
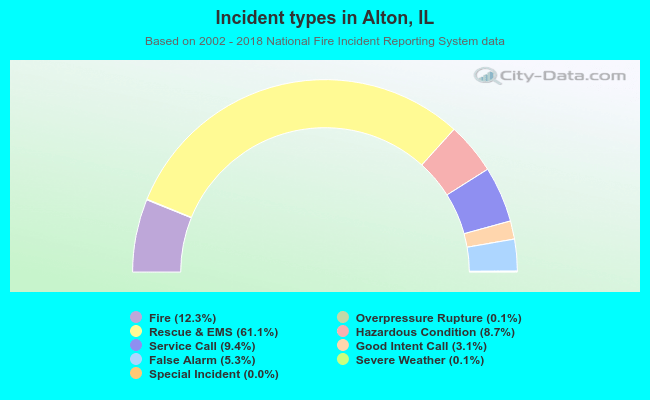 Out of all 26,776 cases reported during the years 2002 - 2018, the most belonged to the categories: Rescue & EMS (61.1%), Fire (12.3%), and Service Call (9.4%).
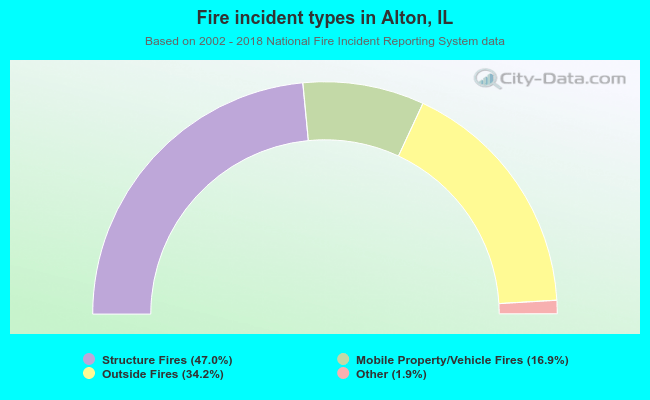 When looking into fire subcategories, the most reports belonged to: Structure Fires (47.0%), and Outside Fires (34.2%).