Almont: Fire Incidents, Michigan (MI)
Where are fire incidents reported in Almont, MI
Something went wrong! Please refresh the page.
|
| |||||||||||||||||||||||||||||||||||||||||||||||||||||||||||||||||||||||||||||||||||||||||||||||||||||||||||||
2002 - 2018 National Fire Incident Reporting System (NFIRS) incidents
- Incident types reported to NFIRS in Almont, MI
- 75755.2%Hazardous Condition
- 28020.4%Fire
- 1057.7%False Alarm
- 765.5%Rescue & EMS
- 755.5%Service Call
- 735.3%Good Intent Call
- 30.2%Special Incident
- 20.1%Severe Weather
- Fire incident types reported to NFIRS in Almont, MI
- 14050.0%Structure Fires
- 8229.3%Outside Fires
- 4415.7%Mobile Property/Vehicle Fires
- 145.0%Other
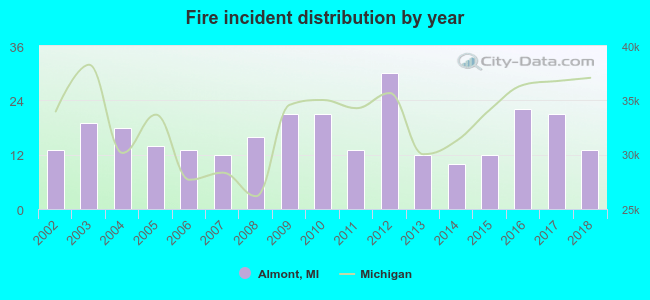 According to the data from the years 2002 - 2018 the average number of fires per year is 16. The highest number of reported fires - 30 took place in 2012, and the least - 10 in 2014. The data has a constant trend.
 27.9% incidents where reported in the morning and 72.1% in the evening. The most fires (19.6%) took place on Monday, and the least (10.4%) on Thursday.
 According to the 280 incident reports from years 2002 - 2018 most fires (13.2%) took place during March, and the least (5.4%) in May.
 Out of all 1,371 cases reported during the years 2002 - 2018, the most belonged to the categories: Rescue & EMS (55.2%), Fire (20.4%), and Good Intent Call (7.7%).
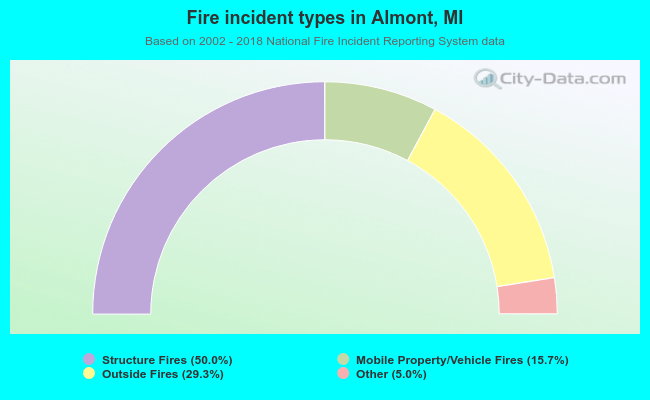 When looking into fire subcategories, the most incidents belonged to: Structure Fires (50.0%), and Outside Fires (29.3%).