Alma: Fire Incidents, Arkansas (AR)
Where are fire incidents reported in Alma, AR
Something went wrong! Please refresh the page.
|
| |||||||||||||||||||||||||||||||||||||||||||||||||||||||||||||||||||||||||||||||||||||||||||||||||||||||||||||
| Other | 264 | |||||||||||||||||||||||||||||||||||||||||||||||||||||||||||||||||||||||||||||||||||||||||||||||||||||||||||||
2002 - 2018 National Fire Incident Reporting System (NFIRS) incidents
- Incident types reported to NFIRS in Alma, AR
- 1,51848.8%Rescue & EMS
- 1,13036.3%Fire
- 2688.6%Good Intent Call
- 1193.8%Hazardous Condition
- 371.2%False Alarm
- 240.8%Service Call
- 100.3%Severe Weather
- Fire incident types reported to NFIRS in Alma, AR
- 69661.6%Outside Fires
- 27924.7%Structure Fires
- 13612.0%Mobile Property/Vehicle Fires
- 191.7%Other
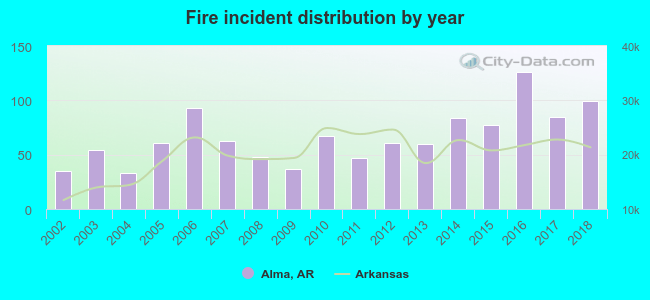 Based on the data from the years 2002 - 2018 the average number of fire incidents per year is 66. The highest number of reported fire incidents - 126 took place in 2016, and the least - 33 in 2004. The data has an increasing trend.
The average number of yearly fire incidents per 10k residents in Alma, AR compared to nearest cities:
(Note: Based on data for the last 3 years, including only cities with population 5,000 and above)
| Alma: | 185.9 |
| Van Buren: | 82.4 |
| Fort Smith: | 46.3 |
| Greenwood: | 84.2 |
 The median response time based on all reported fire incidents is 8 minutes. This is higher than the Arkansas median value.
The median response time in Alma, AR compared to nearest cities:
(Note: Based on data for all years, including only cities with at least 500 fire incidents)
| Alma: | 8 minutes |
| Van Buren: | 5 minutes |
| Mulberry: | 9 minutes |
| Lavaca: | 6 minutes |
| Mountainburg: | 11 minutes |
| Fort Smith: | 3 minutes |
| Charleston: | 8 minutes |
| Greenwood: | 8 minutes |
| Ozark: | 7 minutes |
 22.0% incidents where reported in the morning and 78.0% in the evening. The most fires (17.1%) took place on Saturday, and the least (11.8%) on Monday.
 According to the 1,130 fire incidents from years 2002 - 2018 most fires (14.7%) took place during January, and the least (4.9%) in May.
 Out of all 3,111 cases reported during the years 2002 - 2018, the most belonged to the categories: Rescue & EMS (48.8%), Fire (36.3%), and Good Intent Call (8.6%).
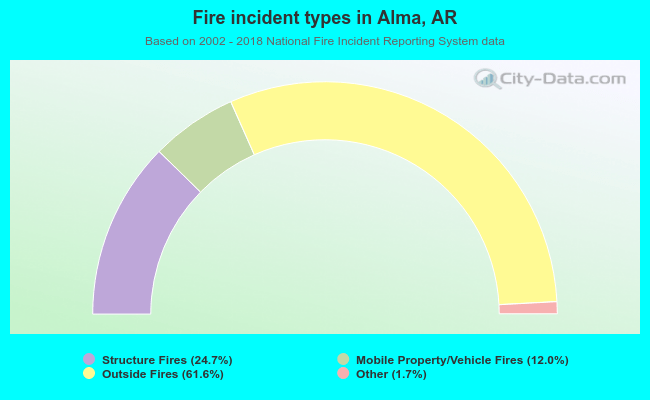 When looking into fire subcategories, the most reports belonged to: Outside Fires (61.6%), and Structure Fires (24.7%).