| Fire incidents reported |
|---|
| Sreet name | Count |
|---|
| I-25 | 26 | | I25 | 16 | | 15775 TRUJILLO CREEK | 4 | | 20781 TRUJILLO CREEK ROAD | 4 | | 39635 CR 60.1 | 4 | | CR 437 | 4 | | I25 NB | 4 | | LOMBARDI AND ROMERO | 4 | | MAURICIO CANYON | 4 | | WEST OF EXIT 23 - CHICOSA CNY | 4 | | 106 E MAIN | 2 | | 116 E CHURCH | 2 | | 123 GRIMES FIELD | 2 | | 133 COTTONWOOD ST | 2 | | 16890 CR 46.0 | 2 | | 18760 CR 54.2 MAURICIO CANYON | 2 | | 1900 SPITIE LAND (CHACOSA CYN) | 2 | | 19915 CR 65.5 | 2 | | 219 S GRIMES | 2 | | 219 S SAN ANTONIO | 2 | | 22100 CR 46.0 | 2 | | 22100 I 25 | 2 | | 22750 CR 46 SOUTH OF GULNARE | 2 | | 24000 RIDGE LANE | 2 | | 24030 ADAMS ROAD | 2 |
| | | Fire incidents reported |
|---|
| Sreet name | Count |
|---|
| 24264 APISHAPA LANE | 2 | | 24470 CR 43.7 | 2 | | 24500 CR 44 APISHAPA | 2 | | 24651 CR 46.0 | 2 | | 26350 COUNTY ROAD 437 | 2 | | 27395 COUNTY ROAD 60 | 2 | | 27602 CR 437 | 2 | | 27701 CR 437 | 2 | | 28515 CR 56.5 | 2 | | 28702 CR 56.5 | 2 | | 28900 LYNN ROAD | 2 | | 314 WEST ST | 2 | | 32410 CR 400 | 2 | | 35359 CR 42.5 | 2 | | 402 MAPLE | 2 | | 421 LINDEN | 2 | | 619 FIRST STREET | 2 | | 619 N. FIRE | 2 | | AGUILAR N BASEBALL FIELD | 2 | | AMATOS TRUCK STOP | 2 | | APISHAPA LANE | 2 | | BASEBALL FIELD | 2 | | BEAR CYN | 2 | | BIG HORN SHEEP RANCH | 2 | | |
|
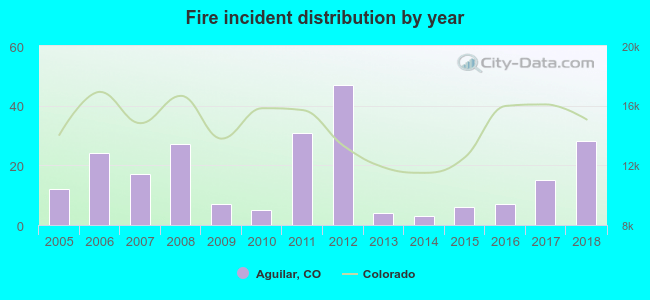 According to the data from the years 2005 - 2018 the average number of fire incidents per year is 17. The highest number of reported fire incidents - 47 took place in 2012, and the least - 3 in 2014. The data has an increasing trend.
 37.3% incidents where reported in the morning and 62.7% in the evening. The most fires (18.9%) took place on Saturday, and the least (8.2%) on Friday.
 Based on the 233 fires from years 2005 - 2018 most fires (26.2%) took place during June, and the least (3.0%) in November.
 Out of all 870 cases reported during the years 2005 - 2018, the most belonged to the categories: Overpressure Rupture (37.9%), Service Call (28.3%), and Fire (26.8%).
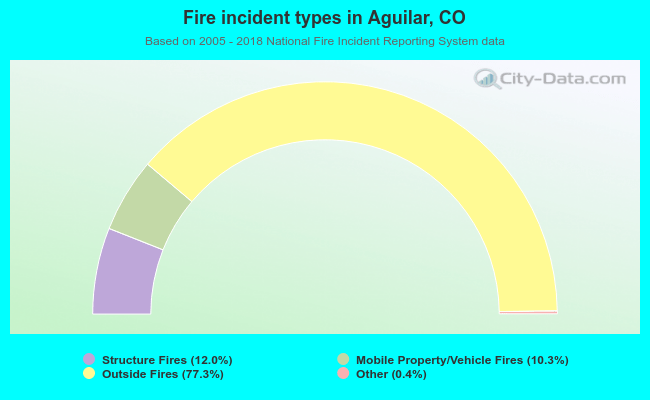 When looking into fire subcategories, the most reports belonged to: Outside Fires (77.3%), and Structure Fires (12.0%).