Crime rate in Woodbranch, Texas (TX): murders, rapes, robberies, assaults, burglaries, thefts, auto thefts, arson, law enforcement employees, police officers, crime map
Crime rate in Woodbranch, TX
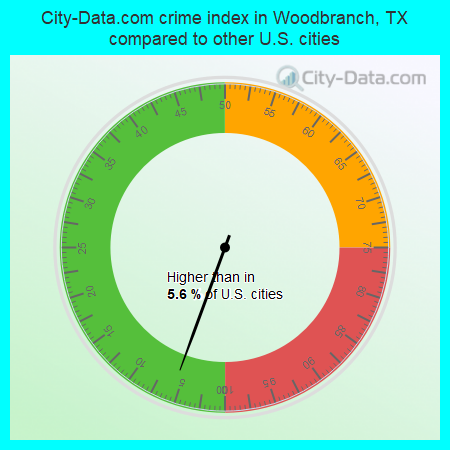
The 2018 crime rate in Woodbranch, TX is 5 (City-Data.com crime index), which is 48.5 times smaller than the U.S. average. It was higher than in 5.6% U.S. cities. The 2018 Woodbranch crime rate fell by 81% compared to 2017. In the last 5 years Woodbranch has seen constant level of violent crime and decreasing property crime.See how dangerous Woodbranch, TX is compared to the nearest cities:
(Note: Higher means more crime)
(Note: Higher means more crime)
| Woodbranch: | 5.1 |
| Patton Village: | 154.0 |
| Roman Forest: | 287.8 |
| Splendora: | 169.9 |
| Cleveland: | 387.0 |
| Humble: | 904.2 |
| Oak Ridge North: | 166.4 |
| Shenandoah: | 506.0 |
| Conroe: | 205.3 |
Type |
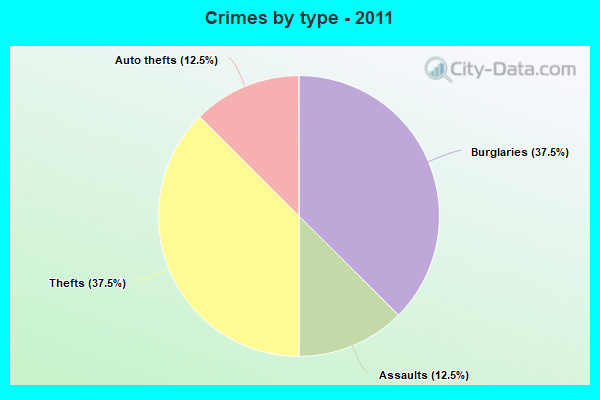
2011 |
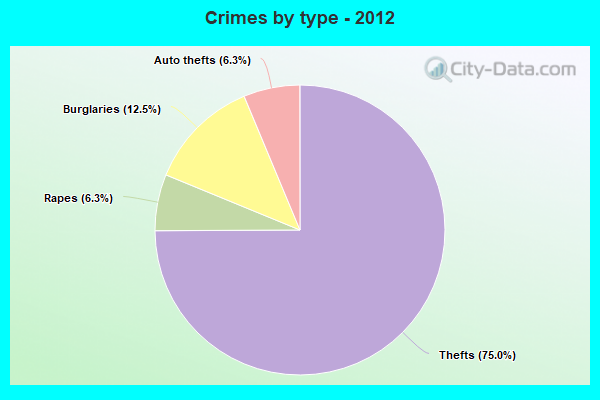
2012 |
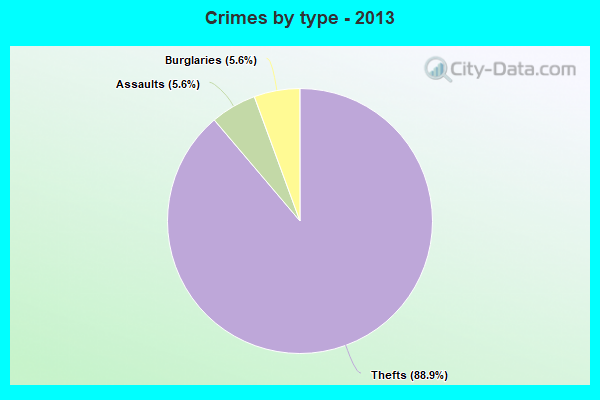
2013 |
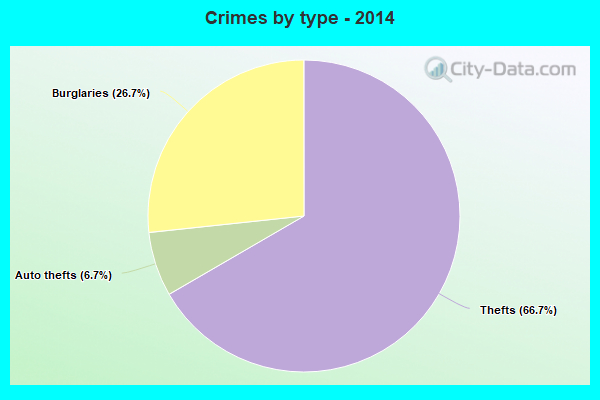
2014 |
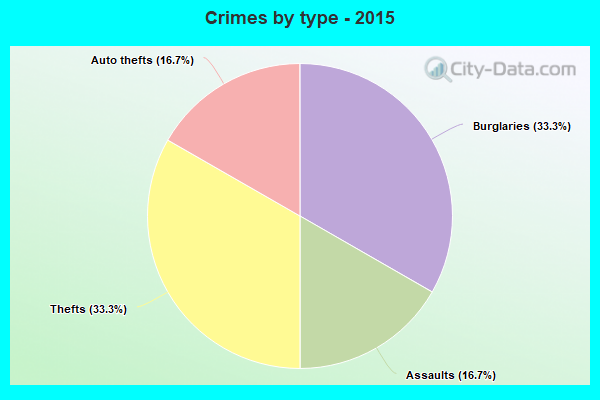
2015 |
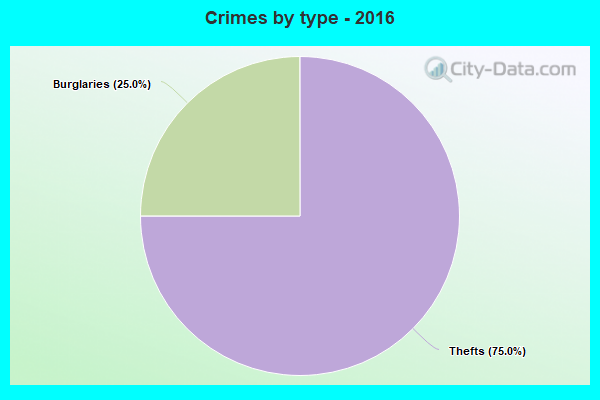
2016 |
2017 |
2018 |
|---|---|---|---|---|---|---|---|---|
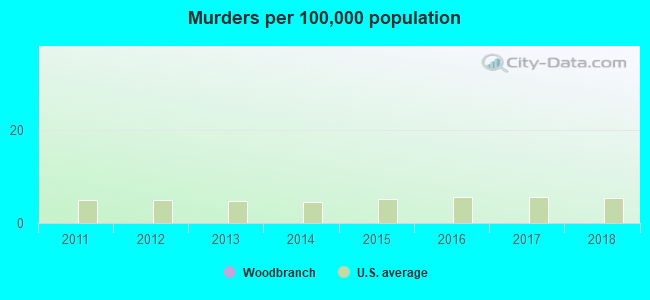
| Murders (per 100,000) | 0 (0.0) | 0 (0.0) | 0 (0.0) | 0 (0.0) | 0 (0.0) | 0 (0.0) | 0 (0.0) | 0 (0.0) |
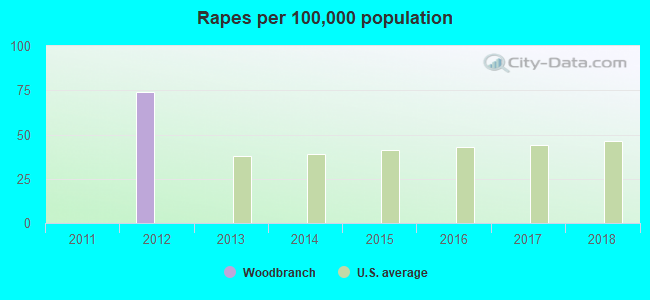
| Rapes (per 100,000) | 0 (0.0) | 1 (74.2) | 0 (0.0) | 0 (0.0) | 0 (0.0) | 0 (0.0) | 0 (0.0) | 0 (0.0) |
| Robberies (per 100,000) | 0 (0.0) | 0 (0.0) | 0 (0.0) | 0 (0.0) | 0 (0.0) | 0 (0.0) | 0 (0.0) | 0 (0.0) |
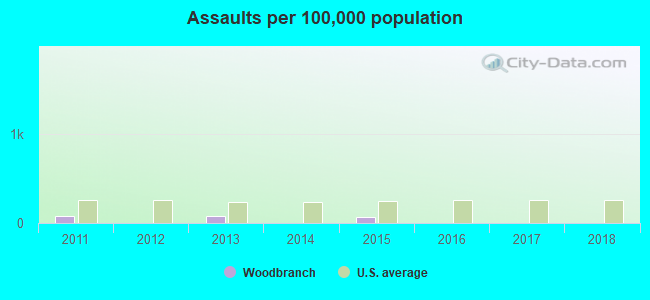
| Assaults (per 100,000) | 1 (76.4) | 0 (0.0) | 1 (74.4) | 0 (0.0) | 1 (72.3) | 0 (0.0) | 0 (0.0) | 0 (0.0) |
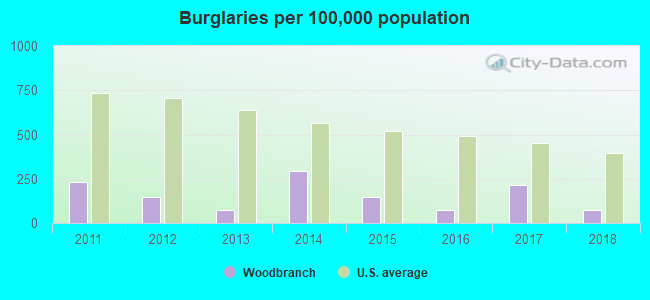
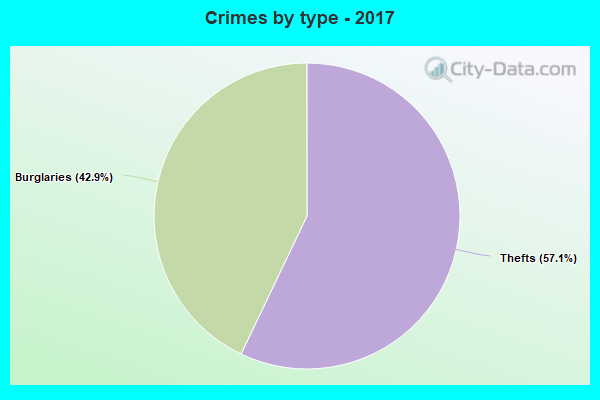
| Burglaries (per 100,000) | 3 (229.2) | 2 (148.4) | 1 (74.4) | 4 (292.6) | 2 (144.5) | 1 (71.6) | 3 (214.9) | 1 (72.5) |
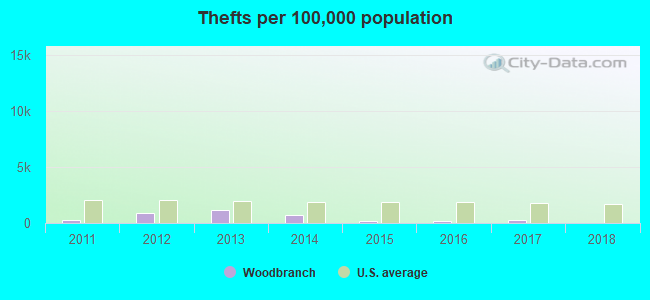
| Thefts (per 100,000) | 3 (229.2) | 12 (890.2) | 16 (1,190) | 10 (731.5) | 2 (144.5) | 3 (214.9) | 4 (286.5) | 0 (0.0) |
| Auto thefts (per 100,000) | 1 (76.4) | 1 (74.2) | 0 (0.0) | 1 (73.2) | 1 (72.3) | 0 (0.0) | 0 (0.0) | 0 (0.0) |
| Arson (per 100,000) | 0 (0.0) | 0 (0.0) | 0 (0.0) | 0 (0.0) | 0 (0.0) | 0 (0.0) | 0 (0.0) | 0 (0.0) |
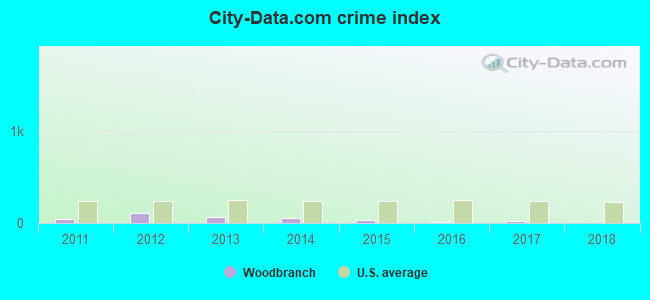
| City-Data.com crime index | 46.6 | 111.3 | 67.7 | 55.6 | 36.1 | 13.6 | 26.5 | 5.1 |
The City-Data.com crime index weighs serious crimes and violent crimes more heavily. Higher means more crime, U.S. average is 246.1. It adjusts for the number of visitors and daily workers commuting into cities.
Violent crime rate in 2018
| Woodbranch: | 0.0 |
| U.S. Average: | 221.2 |
Violent crime rate in 2017
| Woodbranch: | 0.0 |
| U.S. Average: | 226.2 |
Violent crime rate in 2016
| Woodbranch: | 0.0 |
| U.S. Average: | 227.3 |
Violent crime rate in 2015
| Woodbranch: | 36.1 |
| U.S. Average: | 219.3 |
Violent crime rate in 2014
| Woodbranch: | 0.0 |
| U.S. Average: | 211.1 |
Violent crime rate in 2013
| Woodbranch: | 37.2 |
| U.S. Average: | 214.2 |
Violent crime rate in 2012
| Woodbranch: | 74.2 |
| U.S. Average: | 187.4 |
Violent crime rate in 2011
| Woodbranch: | 38.2 |
| U.S. Average: | 187.1 |
Property crime rate in 2018
| Woodbranch: | 14.5 |
| U.S. Average: | 190.2 |
Property crime rate in 2017
| Woodbranch: | 57.3 |
| U.S. Average: | 206.4 |
Property crime rate in 2016
| Woodbranch: | 25.1 |
| U.S. Average: | 216.6 |
Property crime rate in 2015
| Woodbranch: | 47.0 |
| U.S. Average: | 221.5 |
Property crime rate in 2014
| Woodbranch: | 106.1 |
| U.S. Average: | 230.8 |
Property crime rate in 2013
| Woodbranch: | 74.4 |
| U.S. Average: | 250.4 |
Property crime rate in 2012
| Woodbranch: | 85.3 |
| U.S. Average: | 267.3 |
Property crime rate in 2011
| Woodbranch: | 68.8 |
| U.S. Average: | 273.5 |


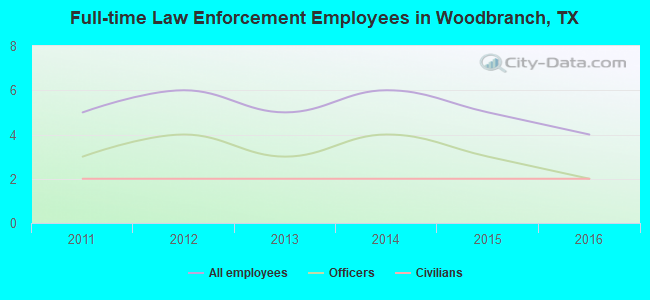
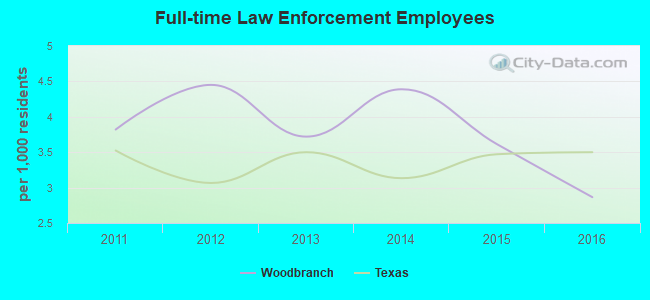
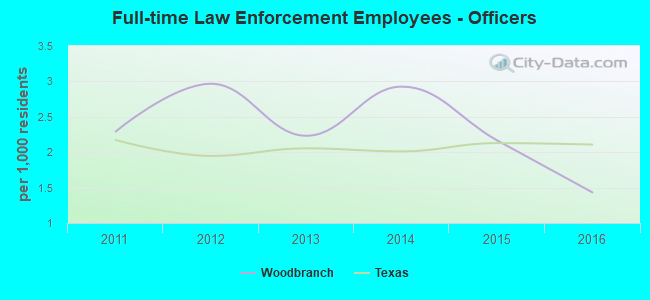
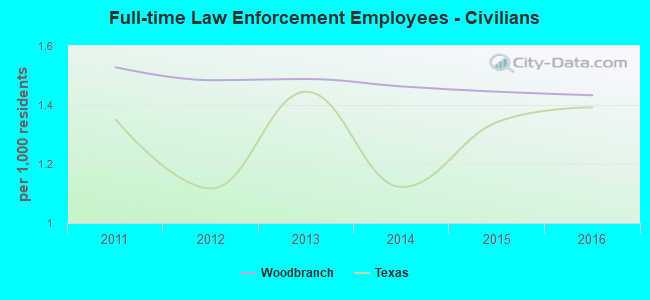
Full-time law enforcement employees in 2016, including police officers: 4 (2 officers - 2 male; 0 female).
| Officers per 1,000 residents here: | 1.43 |
| Texas average: | 2.11 |
Full-time law enforcement employees in 2015, including police officers: 5 (3 officers - 3 male; 0 female).
| Officers per 1,000 residents here: | 2.17 |
| Texas average: | 2.13 |
Full-time law enforcement employees in 2014, including police officers: 6 (4 officers - 4 male; 0 female).
| Officers per 1,000 residents here: | 2.93 |
| Texas average: | 2.01 |
Full-time law enforcement employees in 2013, including police officers: 5 (3 officers - 3 male; 0 female).
| Officers per 1,000 residents here: | 2.23 |
| Texas average: | 2.05 |
Full-time law enforcement employees in 2012, including police officers: 6 (4 officers - 3 male; 1 female).
| Officers per 1,000 residents here: | 2.97 |
| Texas average: | 1.95 |
Full-time law enforcement employees in 2011, including police officers: 5 (3 officers - 3 male; 0 female).
| Officers per 1,000 residents here: | 2.29 |
| Texas average: | 2.17 |
Zip codes: 77357.