Crime rate in Wilmington, Delaware (DE): murders, rapes, robberies, assaults, burglaries, thefts, auto thefts, arson, law enforcement employees, police officers, crime map

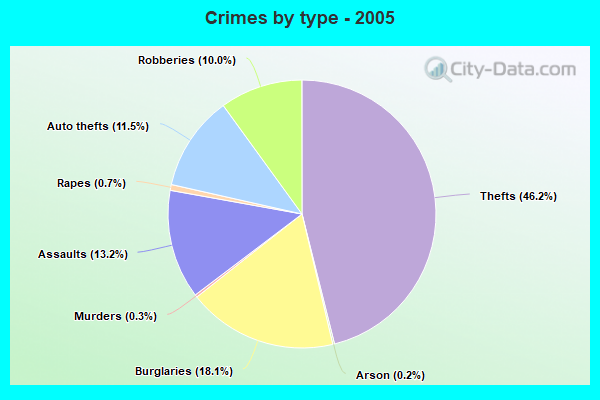
Crime rate in Wilmington, DE
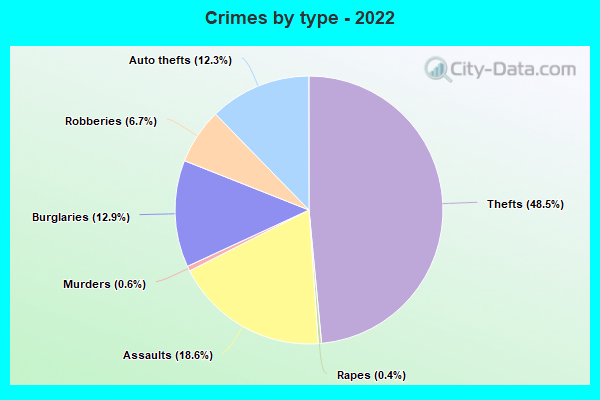
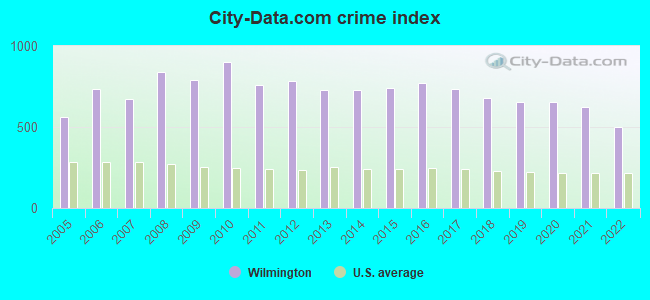
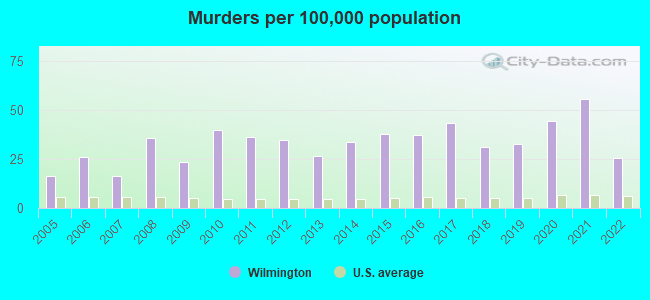
The 2022 crime rate in Wilmington, DE is 502 (City-Data.com crime index), which is 2.0 times higher than the U.S. average. It was higher than in 96.8% U.S. cities. The 2022 Wilmington crime rate fell by 19% compared to 2021. The number of homicides stood at 18 - a decrease of 21 compared to 2021. In the last 5 years Wilmington has seen decreasing violent crime and decline of property crime.See how dangerous Wilmington, DE is compared to the nearest cities:
(Note: Higher means more crime)
(Note: Higher means more crime)
| Wilmington: | 502.0 |
| Elsmere: | 107.5 |
| Newport: | 333.3 |
| Penns Grove: | 350.1 |
| Carneys Point: | 131.8 |
| New Castle: | 266.2 |
| Pennsville: | 175.2 |
| Marcus Hook: | 77.8 |
| Trainer: | 159.0 |
The City-Data.com crime index weighs serious crimes and violent crimes more heavily. Higher means more crime, U.S. average is 246.1. It adjusts for the number of visitors and daily workers commuting into cities.
- means the value is much bigger than the state average.
According to our research of Delaware and other state lists, there were 544 registered sex offenders living in Wilmington, Delaware as of May 21, 2024.
The ratio of all residents to sex offenders in Wilmington is 133 to 1.
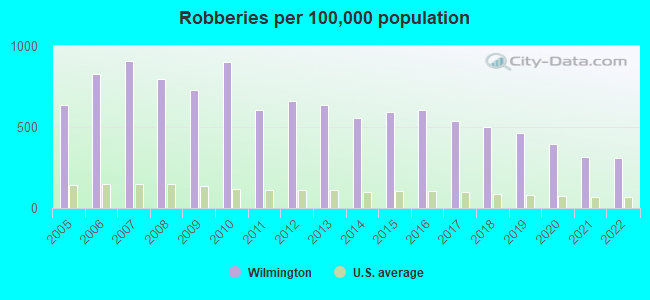
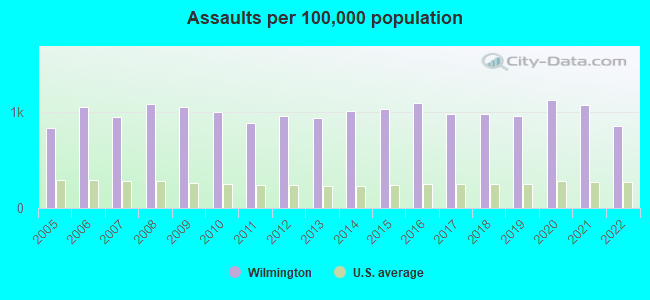
Violent crime rate in 2022
| Wilmington: | 647.1 |
| U.S. Average: | 219.8 |
Violent crime rate in 2021
| Wilmington: | 820.4 |
| U.S. Average: | 224.8 |
Violent crime rate in 2020
| Wilmington: | 884.5 |
| U.S. Average: | 228.2 |
Violent crime rate in 2019
| Wilmington: | 811.3 |
| U.S. Average: | 219.9 |
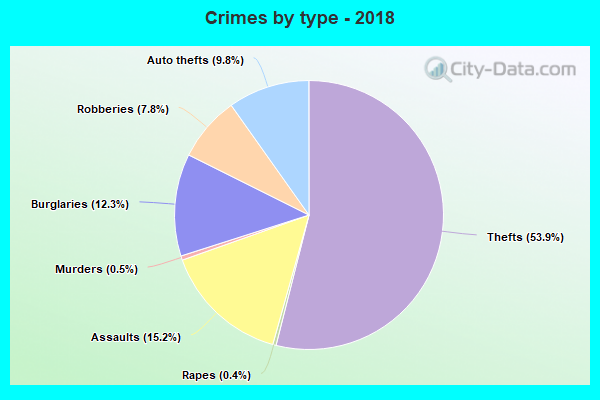
Violent crime rate in 2018
| Wilmington: | 831.3 |
| U.S. Average: | 221.2 |
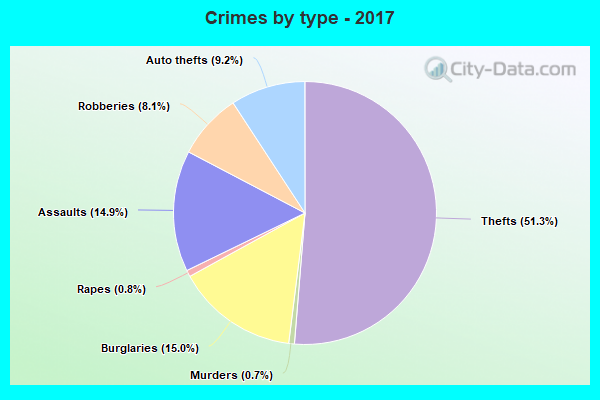
Violent crime rate in 2017
| Wilmington: | 893.8 |
| U.S. Average: | 226.2 |
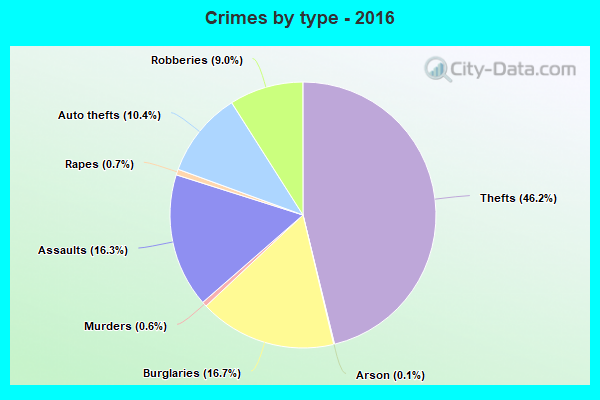
Violent crime rate in 2016
| Wilmington: | 976.0 |
| U.S. Average: | 227.3 |
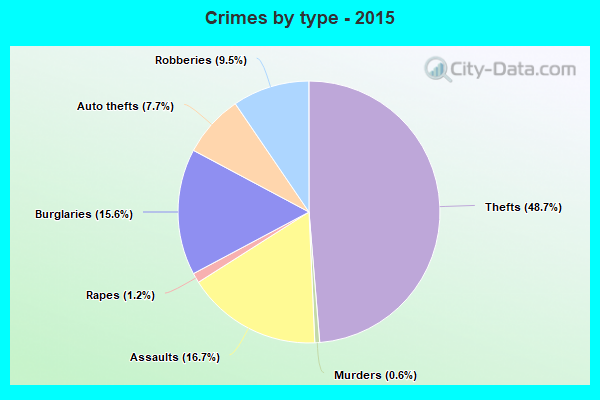
Violent crime rate in 2015
| Wilmington: | 958.7 |
| U.S. Average: | 219.3 |
Violent crime rate in 2014
| Wilmington: | 884.8 |
| U.S. Average: | 211.1 |
Violent crime rate in 2013
| Wilmington: | 872.5 |
| U.S. Average: | 214.2 |
Violent crime rate in 2012
| Wilmington: | 929.4 |
| U.S. Average: | 187.4 |
Violent crime rate in 2011
| Wilmington: | 873.9 |
| U.S. Average: | 187.1 |
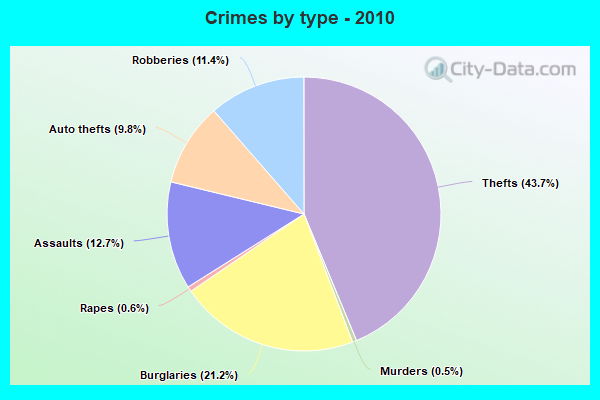
Violent crime rate in 2010
| Wilmington: | 1,074.8 |
| U.S. Average: | 195.7 |
Violent crime rate in 2009
| Wilmington: | 999.6 |
| U.S. Average: | 208.9 |
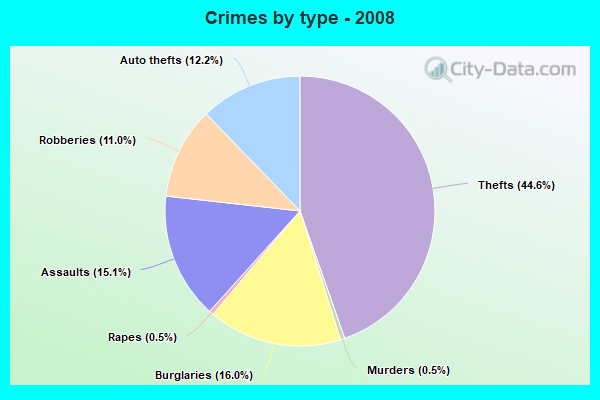
Violent crime rate in 2008
| Wilmington: | 1,051.6 |
| U.S. Average: | 222.5 |
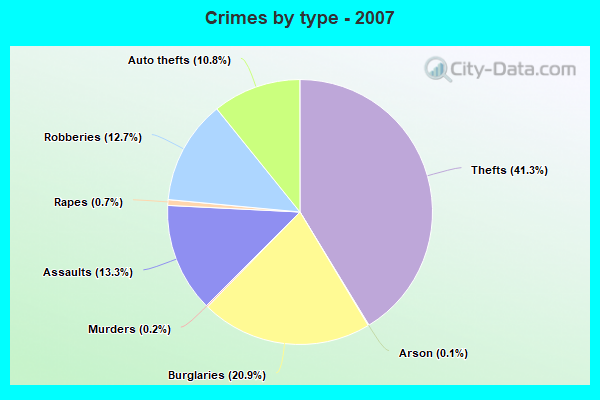
Violent crime rate in 2007
| Wilmington: | 831.9 |
| U.S. Average: | 229.1 |
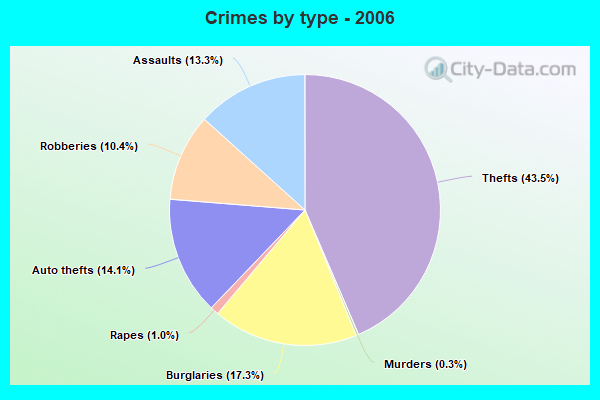
Violent crime rate in 2006
| Wilmington: | 879.2 |
| U.S. Average: | 232.6 |
Violent crime rate in 2005
| Wilmington: | 669.5 |
| U.S. Average: | 227.0 |
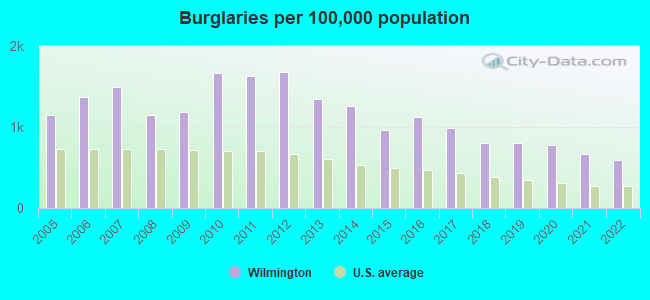
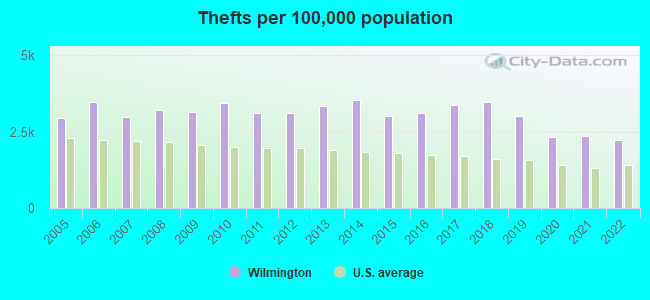
Property crime rate in 2022
| Wilmington: | 313.8 |
| U.S. Average: | 166.5 |
Property crime rate in 2021
| Wilmington: | 344.1 |
| U.S. Average: | 157.8 |
Property crime rate in 2020
| Wilmington: | 363.4 |
| U.S. Average: | 169.6 |
Property crime rate in 2019
| Wilmington: | 407.9 |
| U.S. Average: | 179.7 |
Property crime rate in 2018
| Wilmington: | 428.7 |
| U.S. Average: | 190.2 |
Property crime rate in 2017
| Wilmington: | 456.4 |
| U.S. Average: | 206.4 |
Property crime rate in 2016
| Wilmington: | 484.6 |
| U.S. Average: | 216.6 |
Property crime rate in 2015
| Wilmington: | 415.2 |
| U.S. Average: | 221.5 |
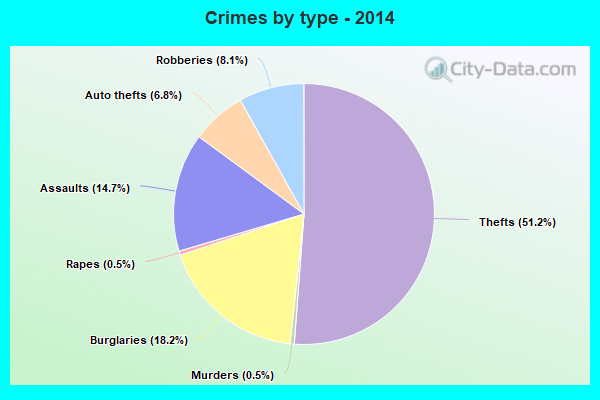
Property crime rate in 2014
| Wilmington: | 497.7 |
| U.S. Average: | 230.8 |
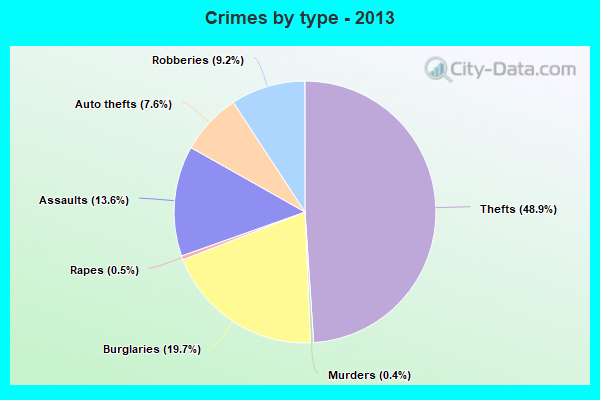
Property crime rate in 2013
| Wilmington: | 515.7 |
| U.S. Average: | 250.4 |
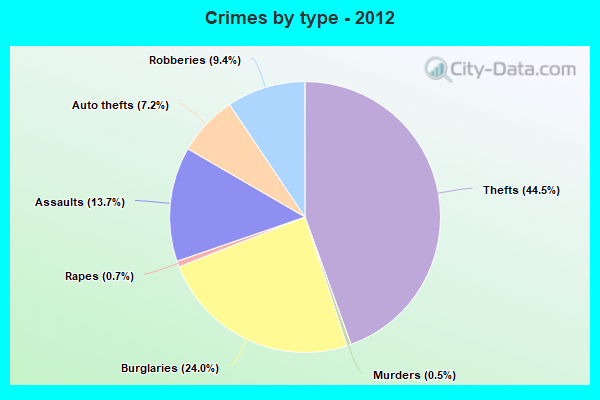
Property crime rate in 2012
| Wilmington: | 568.8 |
| U.S. Average: | 267.3 |
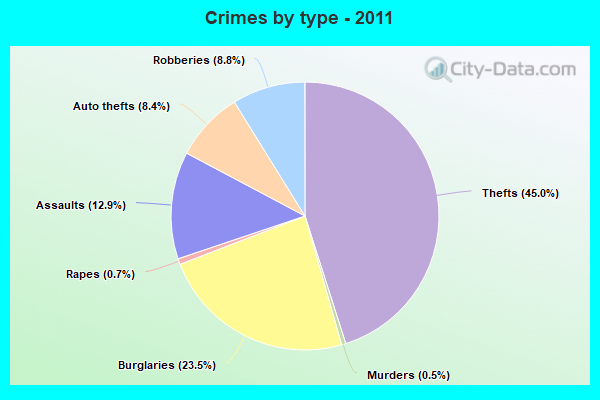
Property crime rate in 2011
| Wilmington: | 567.4 |
| U.S. Average: | 273.5 |
Property crime rate in 2010
| Wilmington: | 621.5 |
| U.S. Average: | 276.4 |
Property crime rate in 2009
| Wilmington: | 500.2 |
| U.S. Average: | 285.6 |
Property crime rate in 2008
| Wilmington: | 523.8 |
| U.S. Average: | 302.2 |
Property crime rate in 2007
| Wilmington: | 463.5 |
| U.S. Average: | 309.2 |
Property crime rate in 2006
| Wilmington: | 506.8 |
| U.S. Average: | 317.3 |
Property crime rate in 2005
| Wilmington: | 400.5 |
| U.S. Average: | 322.3 |
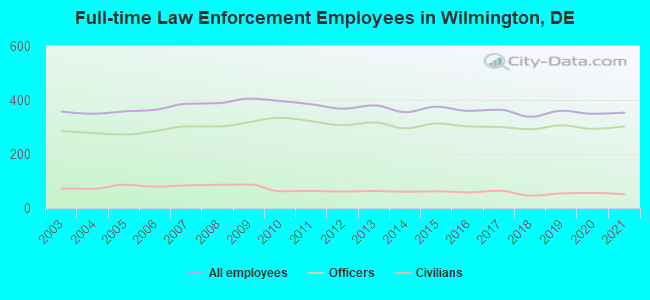
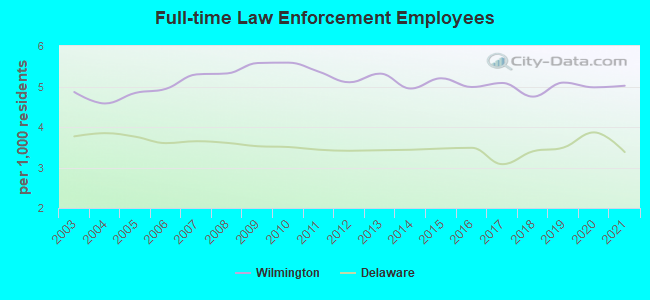
Full-time law enforcement employees in 2021, including police officers: 353 (302 officers - 257 male; 45 female).
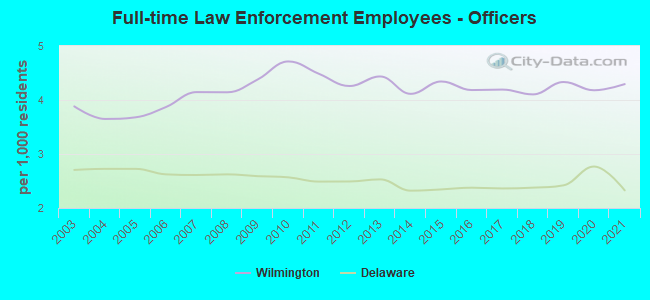
| Officers per 1,000 residents here: | 4.29 |
| Delaware average: | 2.33 |
Full-time law enforcement employees in 2020, including police officers: 349 (293 officers - 250 male; 43 female).
| Officers per 1,000 residents here: | 4.18 |
| Delaware average: | 2.77 |
Full-time law enforcement employees in 2019, including police officers: 360 (306 officers - 259 male; 47 female).
| Officers per 1,000 residents here: | 4.33 |
| Delaware average: | 2.42 |
Full-time law enforcement employees in 2018, including police officers: 338 (292 officers - 248 male; 44 female).
| Officers per 1,000 residents here: | 4.10 |
| Delaware average: | 2.38 |
Full-time law enforcement employees in 2017, including police officers: 364 (300 officers - 257 male; 43 female).
| Officers per 1,000 residents here: | 4.19 |
| Delaware average: | 2.36 |
Full-time law enforcement employees in 2016, including police officers: 360 (302 officers - 264 male; 38 female).
| Officers per 1,000 residents here: | 4.18 |
| Delaware average: | 2.38 |
Full-time law enforcement employees in 2015, including police officers: 375 (313 officers - 275 male; 38 female).
| Officers per 1,000 residents here: | 4.34 |
| Delaware average: | 2.34 |
Full-time law enforcement employees in 2014, including police officers: 355 (295 officers - 266 male; 29 female).
| Officers per 1,000 residents here: | 4.11 |
| Delaware average: | 2.32 |
Full-time law enforcement employees in 2013, including police officers: 380 (317 officers - 284 male; 33 female).
| Officers per 1,000 residents here: | 4.44 |
| Delaware average: | 2.53 |
Full-time law enforcement employees in 2012, including police officers: 368 (307 officers - 274 male; 33 female).
| Officers per 1,000 residents here: | 4.26 |
| Delaware average: | 2.49 |
Full-time law enforcement employees in 2011, including police officers: 384 (321 officers - 286 male; 35 female).
| Officers per 1,000 residents here: | 4.48 |
| Delaware average: | 2.49 |
Full-time law enforcement employees in 2010, including police officers: 396 (334 officers - 298 male; 36 female).
| Officers per 1,000 residents here: | 4.71 |
| Delaware average: | 2.57 |
Full-time law enforcement employees in 2009, including police officers: 405 (318 officers - 286 male; 32 female).
| Officers per 1,000 residents here: | 4.38 |
| Delaware average: | 2.59 |
Full-time law enforcement employees in 2008, including police officers: 388 (302 officers - 272 male; 30 female).
| Officers per 1,000 residents here: | 4.14 |
| Delaware average: | 2.62 |
Full-time law enforcement employees in 2007, including police officers: 386 (302 officers - 273 male; 29 female).
| Officers per 1,000 residents here: | 4.15 |
| Delaware average: | 2.61 |
Full-time law enforcement employees in 2006, including police officers: 364 (285 officers - 258 male; 27 female).
| Officers per 1,000 residents here: | 3.87 |
| Delaware average: | 2.62 |
Full-time law enforcement employees in 2005, including police officers: 358 (272 officers - 244 male; 28 female).
| Officers per 1,000 residents here: | 3.68 |
| Delaware average: | 2.73 |
Full-time law enforcement employees in 2004, including police officers: 349 (278 officers - 253 male; 25 female).
| Officers per 1,000 residents here: | 3.65 |
| Delaware average: | 2.73 |
Full-time law enforcement employees in 2003, including police officers: 357 (285 officers - 259 male; 26 female).
| Officers per 1,000 residents here: | 3.88 |
| Delaware average: | 2.70 |