Crime rate in Union City, New Jersey (NJ): murders, rapes, robberies, assaults, burglaries, thefts, auto thefts, arson, law enforcement employees, police officers, crime map
Crime rate in Union City, NJ
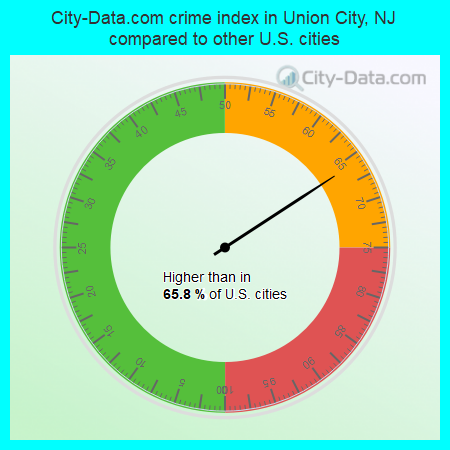
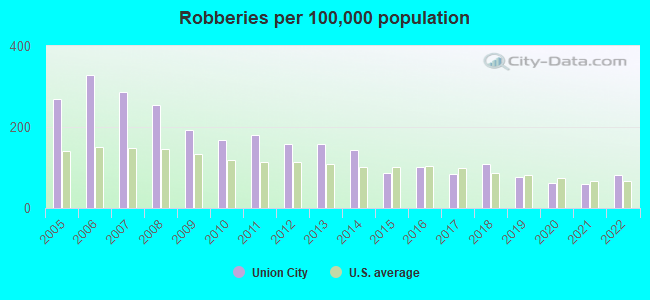
The 2022 crime rate in Union City, NJ is 156 (City-Data.com crime index), which is 1.6 times lower than the U.S. average. It was higher than in 65.8% U.S. cities. The 2022 Union City crime rate rose by 34% compared to 2021. In the last 5 years Union City has seen decreasing violent crime and increasing property crime.See how dangerous Union City, NJ is compared to the nearest cities:
(Note: Higher means more crime)
(Note: Higher means more crime)
| Union City: | 155.9 |
| Hoboken: | 111.4 |
| West New York: | 125.7 |
| Secaucus: | 206.8 |
| Guttenberg: | 132.6 |
| Jersey City: | 128.9 |
| Fairview: | 62.8 |
| Cliffside Park: | 31.3 |
| Ridgefield: | 40.5 |
The City-Data.com crime index weighs serious crimes and violent crimes more heavily. Higher means more crime, U.S. average is 246.1. It adjusts for the number of visitors and daily workers commuting into cities.
- means the value is smaller than the state average.- means the value is about the same as the state average.
- means the value is bigger than the state average.
- means the value is much bigger than the state average.
According to our research of New Jersey and other state lists, there were 29 registered sex offenders living in Union City, New Jersey as of May 22, 2024.
The ratio of all residents to sex offenders in Union City is 2,390 to 1.
The ratio of registered sex offenders to all residents in this city is lower than the state average.
Violent crime rate in 2022
| Union City: | 169.8 |
| U.S. Average: | 219.8 |
Violent crime rate in 2021
| Union City: | 132.8 |
| U.S. Average: | 224.8 |
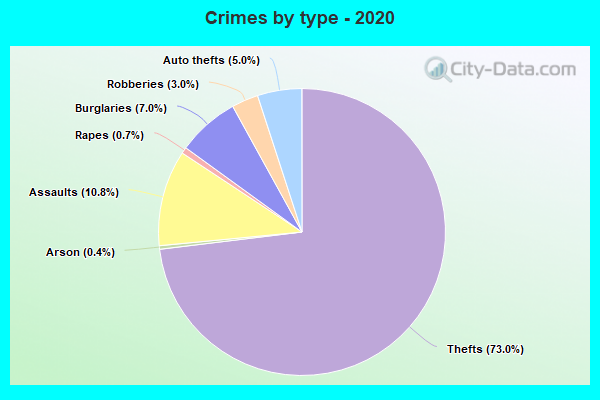
Violent crime rate in 2020
| Union City: | 156.5 |
| U.S. Average: | 228.2 |
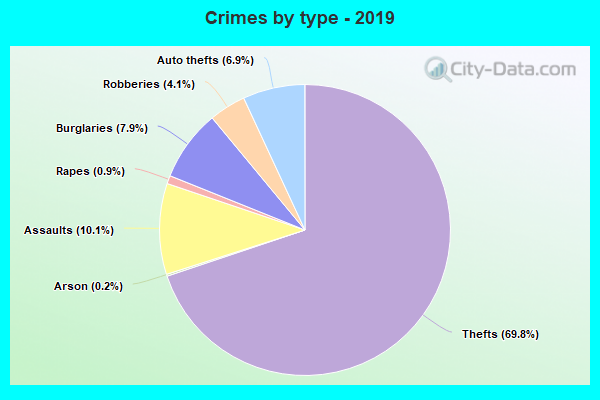
Violent crime rate in 2019
| Union City: | 149.7 |
| U.S. Average: | 219.9 |
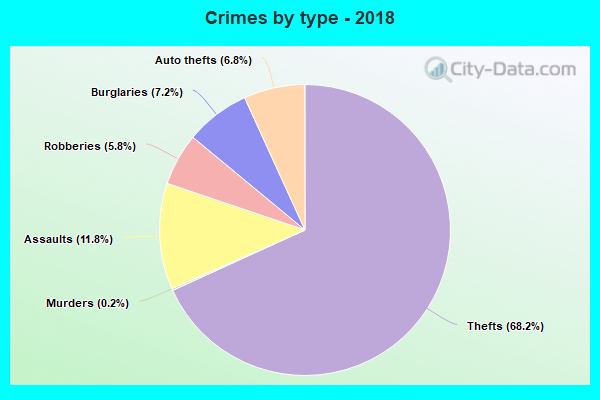
Violent crime rate in 2018
| Union City: | 170.8 |
| U.S. Average: | 221.2 |
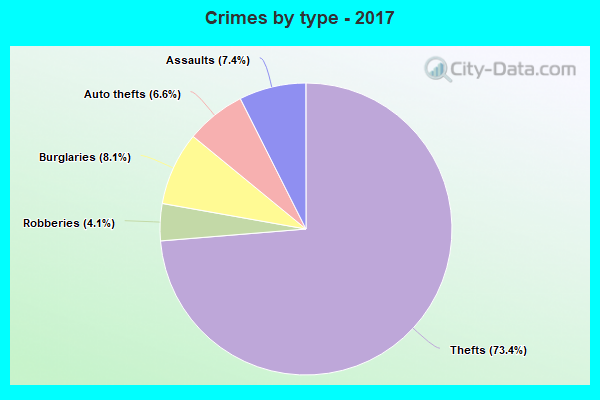
Violent crime rate in 2017
| Union City: | 119.9 |
| U.S. Average: | 226.2 |
Violent crime rate in 2016
| Union City: | 155.0 |
| U.S. Average: | 227.3 |
Violent crime rate in 2015
| Union City: | 120.2 |
| U.S. Average: | 219.3 |
Violent crime rate in 2014
| Union City: | 174.5 |
| U.S. Average: | 211.1 |
Violent crime rate in 2013
| Union City: | 180.9 |
| U.S. Average: | 214.2 |
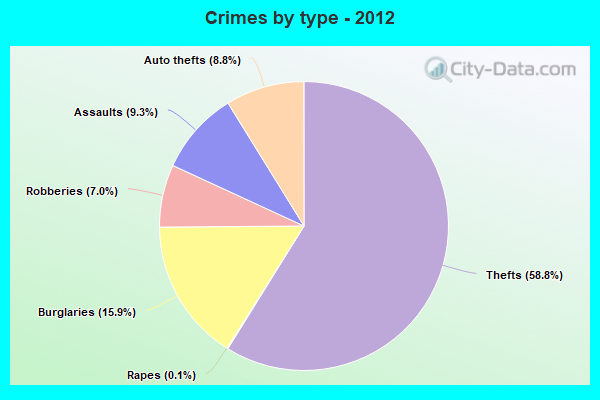
Violent crime rate in 2012
| Union City: | 188.8 |
| U.S. Average: | 187.4 |
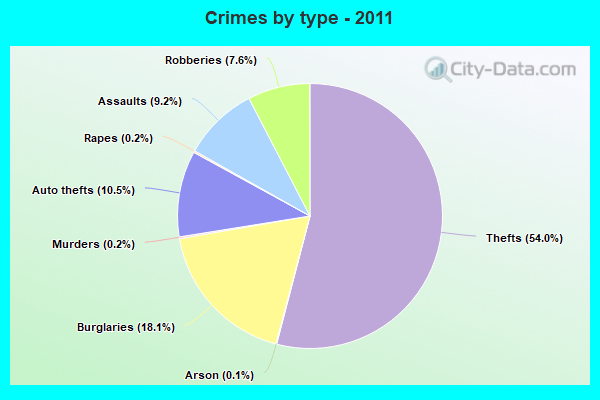
Violent crime rate in 2011
| Union City: | 211.5 |
| U.S. Average: | 187.1 |
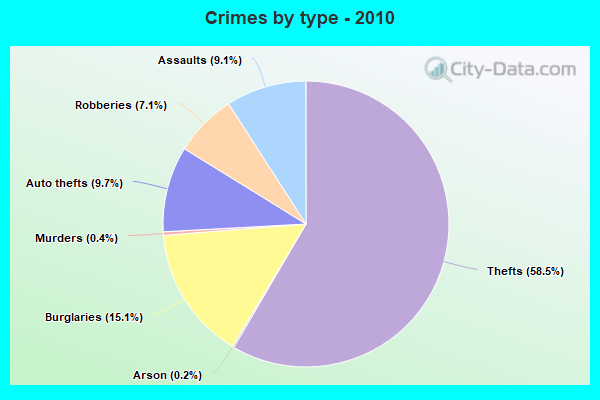
Violent crime rate in 2010
| Union City: | 212.2 |
| U.S. Average: | 195.7 |
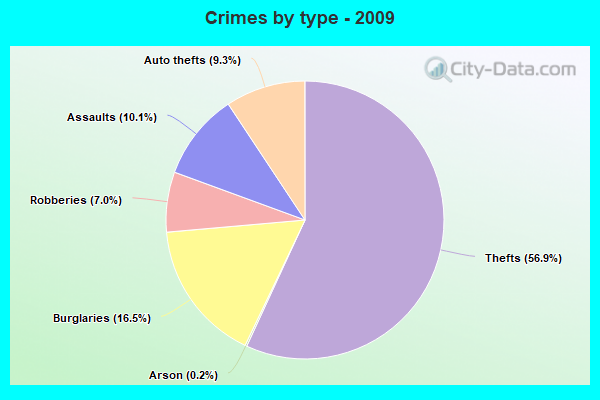
Violent crime rate in 2009
| Union City: | 238.4 |
| U.S. Average: | 208.9 |
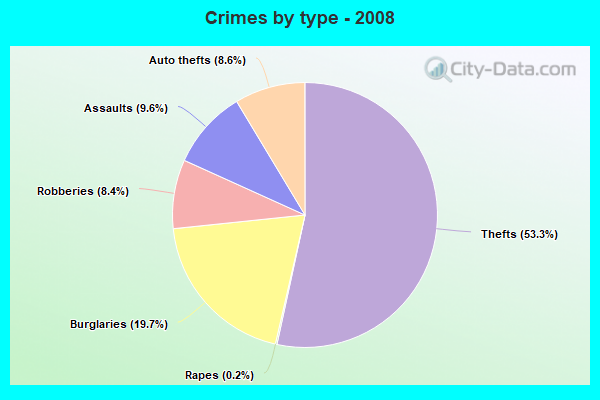
Violent crime rate in 2008
| Union City: | 281.0 |
| U.S. Average: | 222.5 |
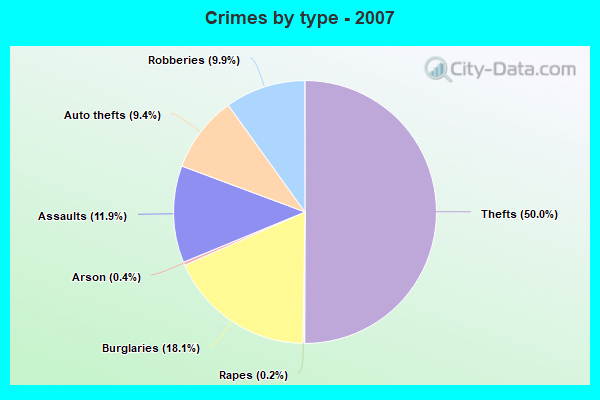
Violent crime rate in 2007
| Union City: | 272.8 |
| U.S. Average: | 229.1 |
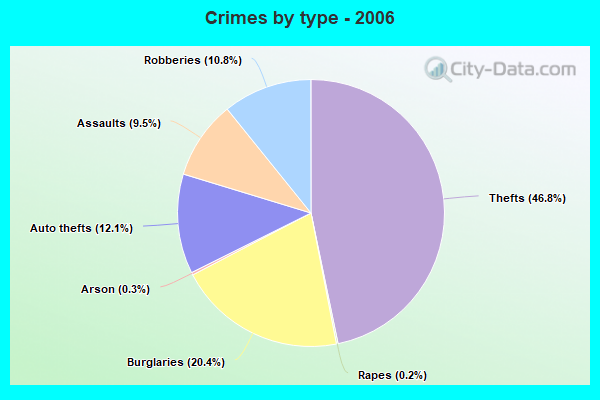
Violent crime rate in 2006
| Union City: | 267.0 |
| U.S. Average: | 232.6 |
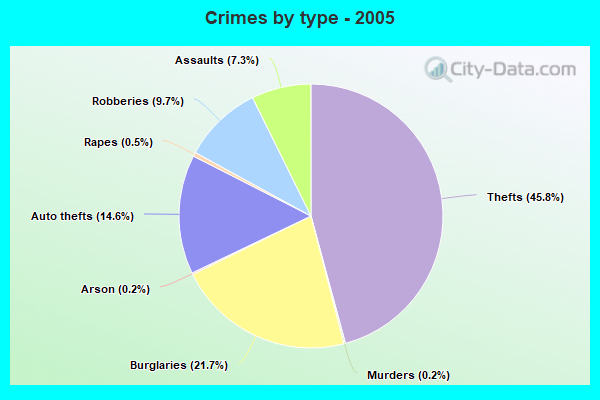
Violent crime rate in 2005
| Union City: | 218.1 |
| U.S. Average: | 227.0 |
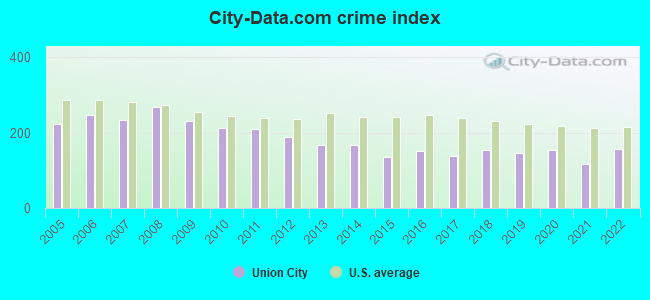
Property crime rate in 2022
| Union City: | 116.2 |
| U.S. Average: | 166.5 |
Property crime rate in 2021
| Union City: | 84.4 |
| U.S. Average: | 157.8 |
Property crime rate in 2020
| Union City: | 118.9 |
| U.S. Average: | 169.6 |
Property crime rate in 2019
| Union City: | 113.9 |
| U.S. Average: | 179.7 |
Property crime rate in 2018
| Union City: | 110.2 |
| U.S. Average: | 190.2 |
Property crime rate in 2017
| Union City: | 125.8 |
| U.S. Average: | 206.4 |
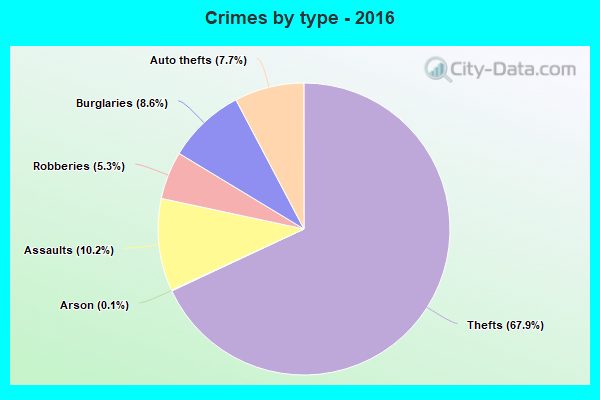
Property crime rate in 2016
| Union City: | 121.9 |
| U.S. Average: | 216.6 |
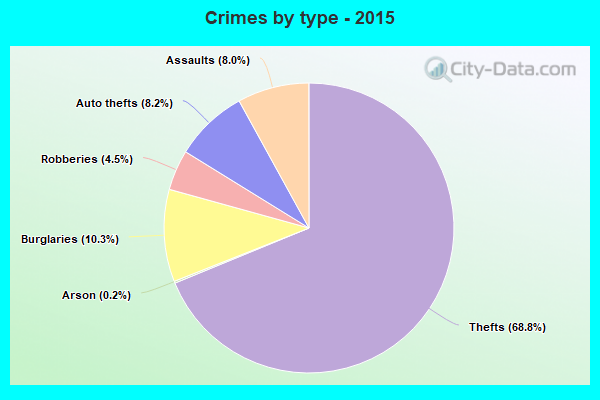
Property crime rate in 2015
| Union City: | 129.4 |
| U.S. Average: | 221.5 |
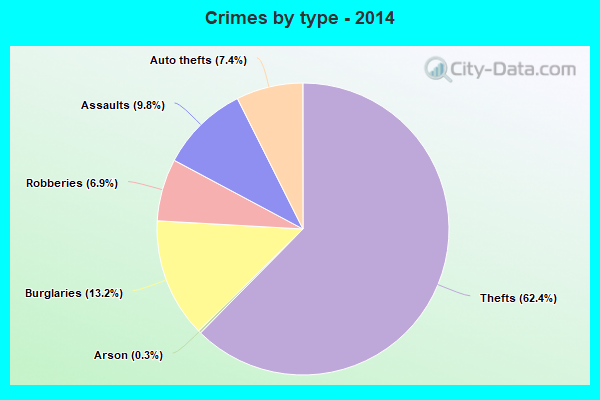
Property crime rate in 2014
| Union City: | 142.8 |
| U.S. Average: | 230.8 |
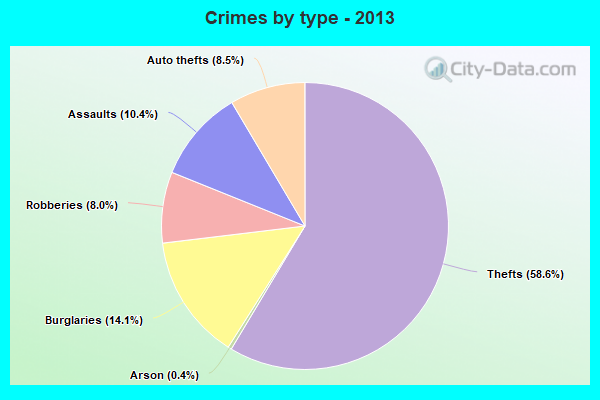
Property crime rate in 2013
| Union City: | 138.1 |
| U.S. Average: | 250.4 |
Property crime rate in 2012
| Union City: | 166.9 |
| U.S. Average: | 267.3 |
Property crime rate in 2011
| Union City: | 186.3 |
| U.S. Average: | 273.5 |
Property crime rate in 2010
| Union City: | 174.9 |
| U.S. Average: | 276.4 |
Property crime rate in 2009
| Union City: | 206.7 |
| U.S. Average: | 285.6 |
Property crime rate in 2008
| Union City: | 237.3 |
| U.S. Average: | 302.2 |
Property crime rate in 2007
| Union City: | 182.6 |
| U.S. Average: | 309.2 |
Property crime rate in 2006
| Union City: | 211.0 |
| U.S. Average: | 317.3 |
Property crime rate in 2005
| Union City: | 204.2 |
| U.S. Average: | 322.3 |
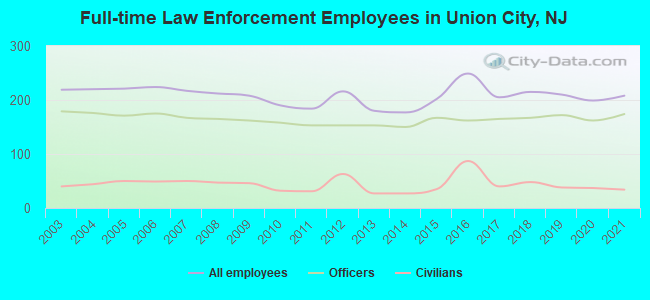
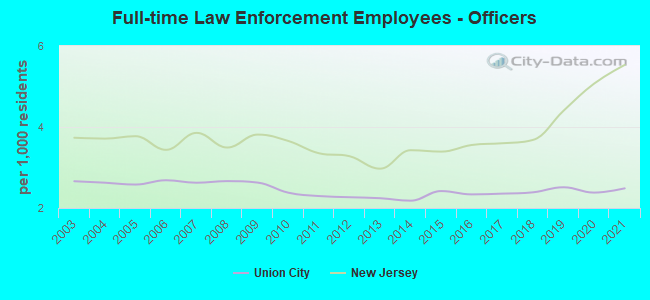
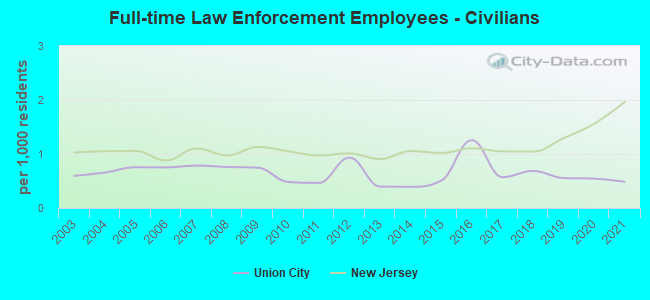
Full-time law enforcement employees in 2021, including police officers: 208 (174 officers - 148 male; 26 female).
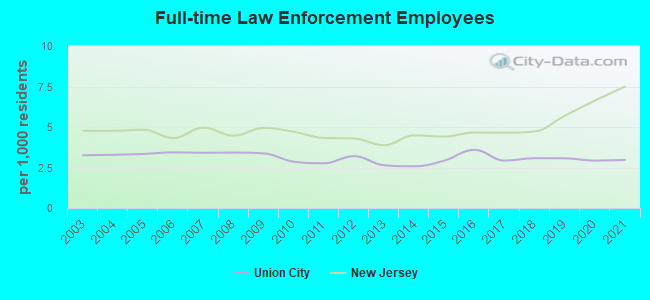
| Officers per 1,000 residents here: | 2.48 |
| New Jersey average: | 5.53 |
Full-time law enforcement employees in 2020, including police officers: 199 (162 officers - 138 male; 24 female).
| Officers per 1,000 residents here: | 2.38 |
| New Jersey average: | 5.07 |
Full-time law enforcement employees in 2019, including police officers: 210 (172 officers - 148 male; 24 female).
| Officers per 1,000 residents here: | 2.51 |
| New Jersey average: | 4.40 |
Full-time law enforcement employees in 2018, including police officers: 215 (167 officers - 144 male; 23 female).
| Officers per 1,000 residents here: | 2.39 |
| New Jersey average: | 3.68 |
Full-time law enforcement employees in 2017, including police officers: 205 (165 officers - 145 male; 20 female).
| Officers per 1,000 residents here: | 2.36 |
| New Jersey average: | 3.60 |
Full-time law enforcement employees in 2016, including police officers: 249 (162 officers - 143 male; 19 female).
| Officers per 1,000 residents here: | 2.34 |
| New Jersey average: | 3.56 |
Full-time law enforcement employees in 2015, including police officers: 202 (167 officers - 147 male; 20 female).
| Officers per 1,000 residents here: | 2.42 |
| New Jersey average: | 3.39 |
Full-time law enforcement employees in 2014, including police officers: 177 (150 officers - 133 male; 17 female).
| Officers per 1,000 residents here: | 2.18 |
| New Jersey average: | 3.43 |
Full-time law enforcement employees in 2013, including police officers: 180 (153 officers - 135 male; 18 female).
| Officers per 1,000 residents here: | 2.24 |
| New Jersey average: | 2.97 |
Full-time law enforcement employees in 2012, including police officers: 216 (153 officers - 139 male; 14 female).
| Officers per 1,000 residents here: | 2.27 |
| New Jersey average: | 3.28 |
Full-time law enforcement employees in 2011, including police officers: 184 (153 officers - 139 male; 14 female).
| Officers per 1,000 residents here: | 2.29 |
| New Jersey average: | 3.35 |
Full-time law enforcement employees in 2010, including police officers: 190 (158 officers - 144 male; 14 female).
| Officers per 1,000 residents here: | 2.38 |
| New Jersey average: | 3.66 |
Full-time law enforcement employees in 2009, including police officers: 208 (162 officers - 150 male; 12 female).
| Officers per 1,000 residents here: | 2.63 |
| New Jersey average: | 3.81 |
Full-time law enforcement employees in 2008, including police officers: 212 (165 officers - 153 male; 12 female).
| Officers per 1,000 residents here: | 2.66 |
| New Jersey average: | 3.49 |
Full-time law enforcement employees in 2007, including police officers: 217 (167 officers - 154 male; 13 female).
| Officers per 1,000 residents here: | 2.62 |
| New Jersey average: | 3.86 |
Full-time law enforcement employees in 2006, including police officers: 224 (175 officers - 161 male; 14 female).
| Officers per 1,000 residents here: | 2.68 |
| New Jersey average: | 3.44 |
Full-time law enforcement employees in 2005, including police officers: 221 (171 officers - 159 male; 12 female).
| Officers per 1,000 residents here: | 2.58 |
| New Jersey average: | 3.77 |
Full-time law enforcement employees in 2004, including police officers: 220 (176 officers - 164 male; 12 female).
| Officers per 1,000 residents here: | 2.63 |
| New Jersey average: | 3.71 |
Full-time law enforcement employees in 2003, including police officers: 219 (179 officers - 169 male; 10 female).
| Officers per 1,000 residents here: | 2.66 |
| New Jersey average: | 3.74 |
Zip codes: 07087.