Crime rate in Syracuse, New York (NY): murders, rapes, robberies, assaults, burglaries, thefts, auto thefts, arson, law enforcement employees, police officers, crime map
Crime rate in Syracuse, NY
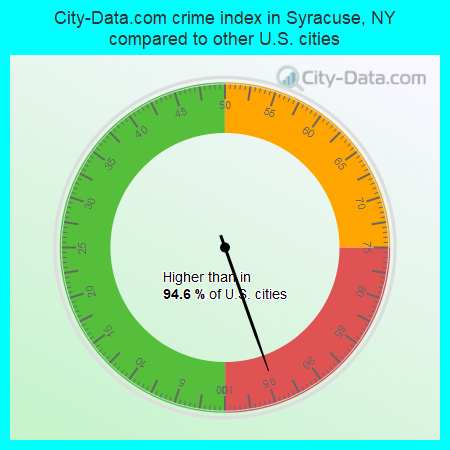
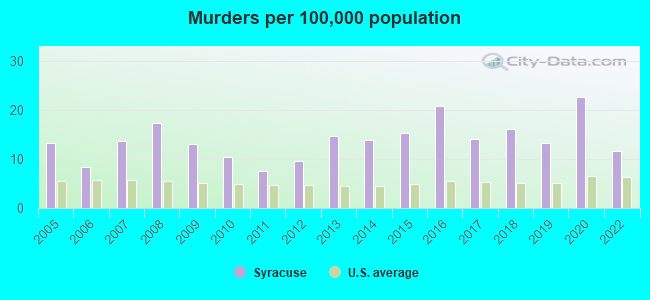
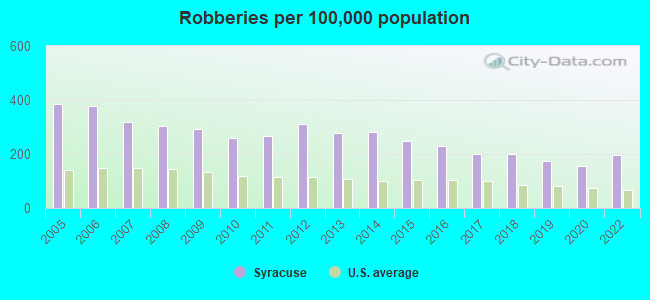
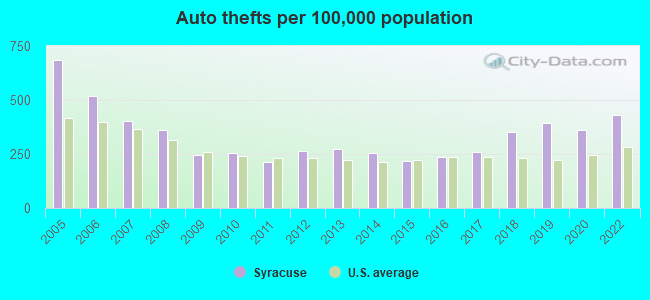
The 2022 crime rate in Syracuse, NY is 416 (City-Data.com crime index), which is 1.7 times greater than the U.S. average. It was higher than in 94.6% U.S. cities. The 2022 Syracuse crime rate rose by 0% compared to 2020. The number of homicides stood at 17 - a decrease of 15 compared to 2020. In the last 5 years Syracuse has seen increasing violent crime and rise of property crime.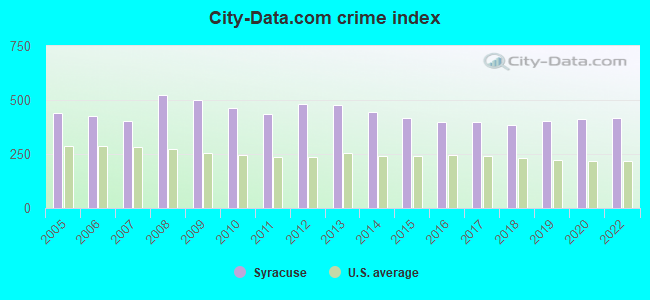
The City-Data.com crime index weighs serious crimes and violent crimes more heavily. Higher means more crime, U.S. average is 246.1. It adjusts for the number of visitors and daily workers commuting into cities.
- means the value is about the same as the state average.- means the value is bigger than the state average.
- means the value is much bigger than the state average.
According to our research of New York and other state lists, there were 632 registered sex offenders living in Syracuse, New York as of May 20, 2024.
The ratio of all residents to sex offenders in Syracuse is 227 to 1.
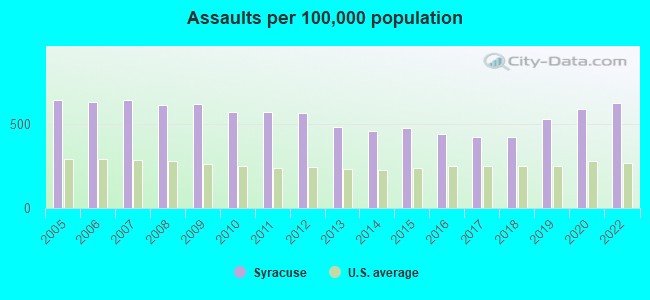
Violent crime rate in 2022
| Syracuse: | 490.8 |
| U.S. Average: | 219.8 |
Violent crime rate in 2020
| Syracuse: | 487.3 |
| U.S. Average: | 228.2 |
Violent crime rate in 2019
| Syracuse: | 453.2 |
| U.S. Average: | 219.9 |
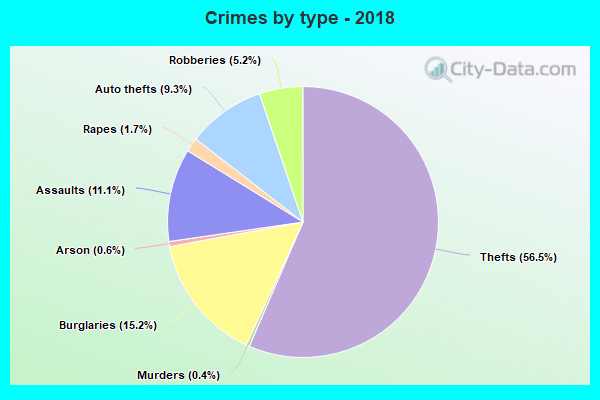
Violent crime rate in 2018
| Syracuse: | 407.7 |
| U.S. Average: | 221.2 |
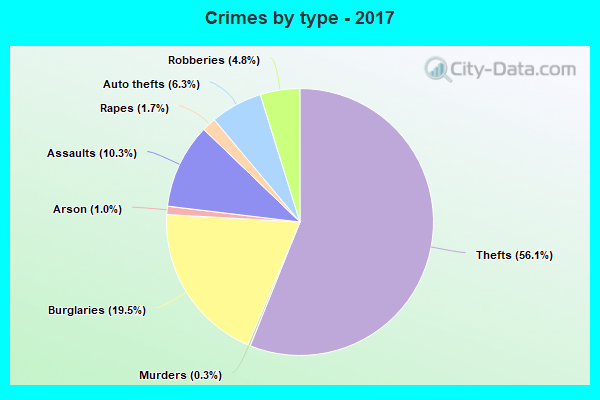
Violent crime rate in 2017
| Syracuse: | 407.8 |
| U.S. Average: | 226.2 |
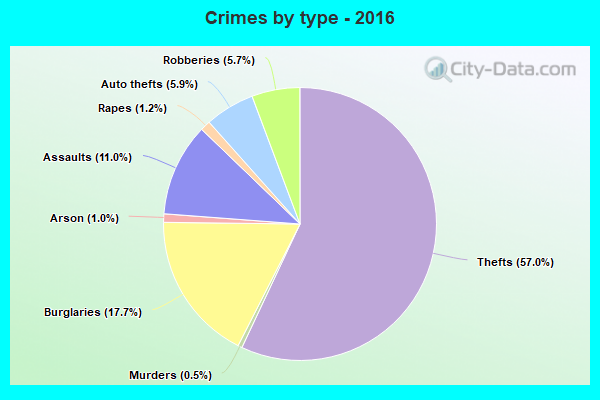
Violent crime rate in 2016
| Syracuse: | 424.2 |
| U.S. Average: | 227.3 |
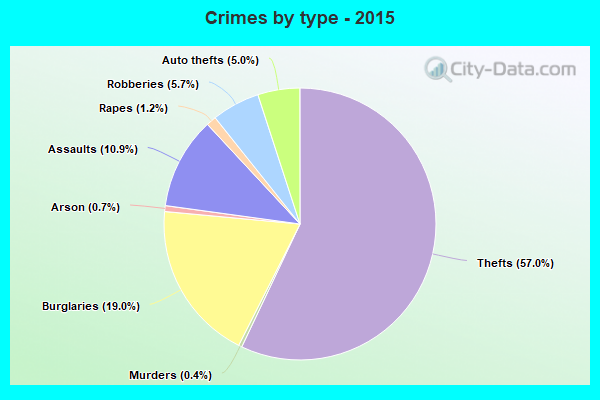
Violent crime rate in 2015
| Syracuse: | 446.1 |
| U.S. Average: | 219.3 |
Violent crime rate in 2014
| Syracuse: | 453.2 |
| U.S. Average: | 211.1 |
Violent crime rate in 2013
| Syracuse: | 462.3 |
| U.S. Average: | 214.2 |
Violent crime rate in 2012
| Syracuse: | 510.2 |
| U.S. Average: | 187.4 |
Violent crime rate in 2011
| Syracuse: | 479.4 |
| U.S. Average: | 187.1 |
Violent crime rate in 2010
| Syracuse: | 483.6 |
| U.S. Average: | 195.7 |
Violent crime rate in 2009
| Syracuse: | 534.6 |
| U.S. Average: | 208.9 |
Violent crime rate in 2008
| Syracuse: | 545.9 |
| U.S. Average: | 222.5 |
Violent crime rate in 2007
| Syracuse: | 435.9 |
| U.S. Average: | 229.1 |
Violent crime rate in 2006
| Syracuse: | 445.1 |
| U.S. Average: | 232.6 |
Violent crime rate in 2005
| Syracuse: | 463.9 |
| U.S. Average: | 227.0 |
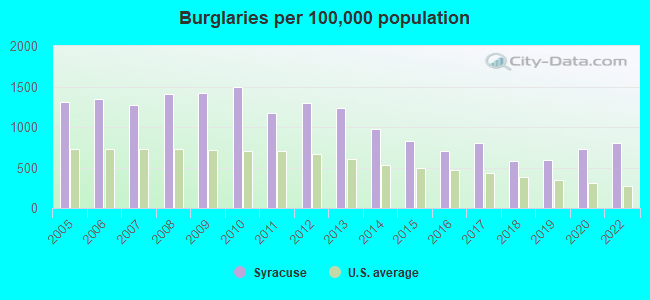
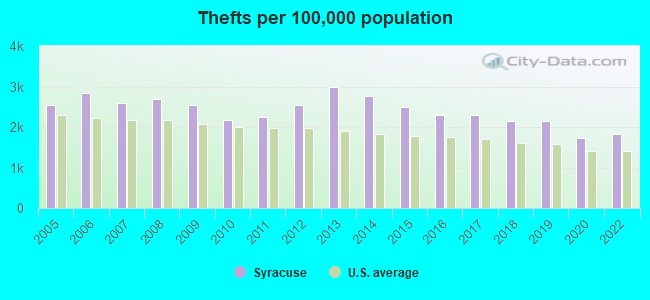
Property crime rate in 2022
| Syracuse: | 316.5 |
| U.S. Average: | 166.5 |
Property crime rate in 2020
| Syracuse: | 286.4 |
| U.S. Average: | 169.6 |
Property crime rate in 2019
| Syracuse: | 285.7 |
| U.S. Average: | 179.7 |
Property crime rate in 2018
| Syracuse: | 276.8 |
| U.S. Average: | 190.2 |
Property crime rate in 2017
| Syracuse: | 314.3 |
| U.S. Average: | 206.4 |
Property crime rate in 2016
| Syracuse: | 291.6 |
| U.S. Average: | 216.6 |
Property crime rate in 2015
| Syracuse: | 322.9 |
| U.S. Average: | 221.5 |
Property crime rate in 2014
| Syracuse: | 370.1 |
| U.S. Average: | 230.8 |
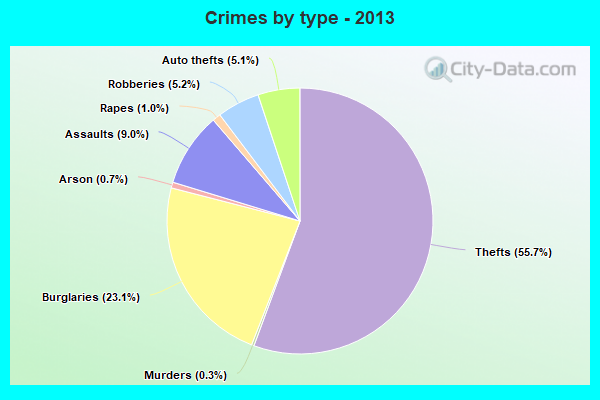
Property crime rate in 2013
| Syracuse: | 438.1 |
| U.S. Average: | 250.4 |
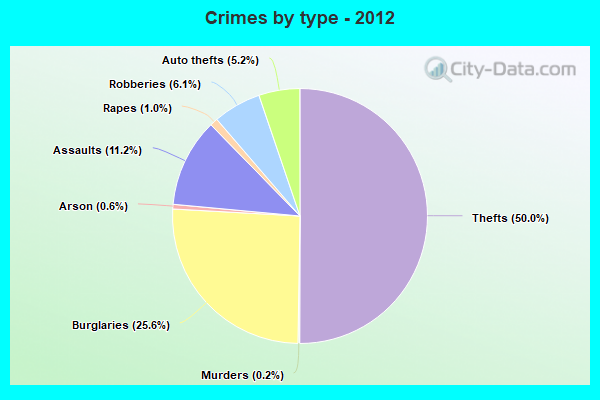
Property crime rate in 2012
| Syracuse: | 425.8 |
| U.S. Average: | 267.3 |
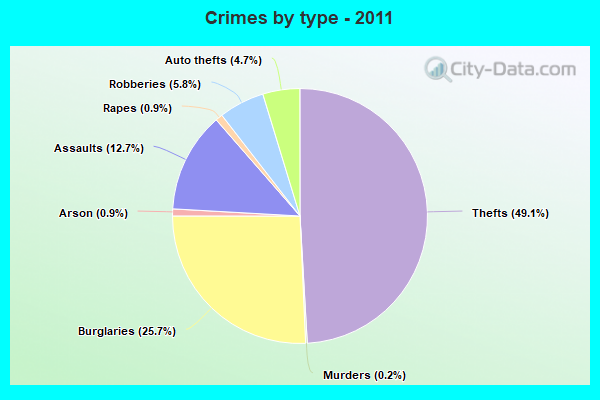
Property crime rate in 2011
| Syracuse: | 377.4 |
| U.S. Average: | 273.5 |
Property crime rate in 2010
| Syracuse: | 446.5 |
| U.S. Average: | 276.4 |
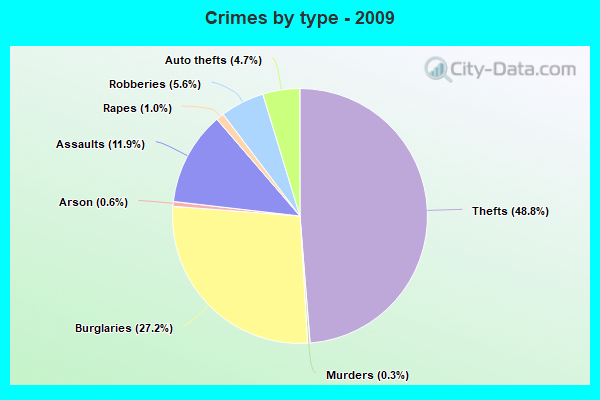
Property crime rate in 2009
| Syracuse: | 448.0 |
| U.S. Average: | 285.6 |
Property crime rate in 2008
| Syracuse: | 469.7 |
| U.S. Average: | 302.2 |
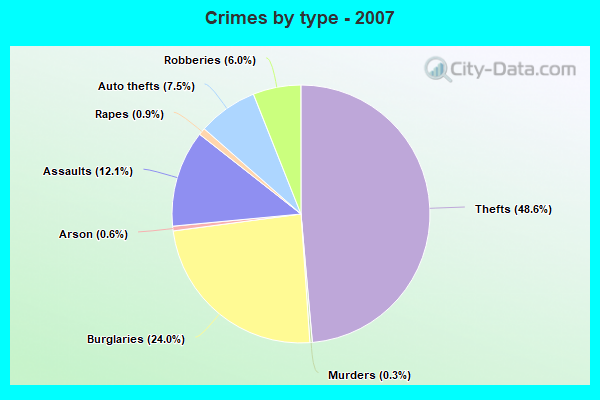
Property crime rate in 2007
| Syracuse: | 347.8 |
| U.S. Average: | 309.2 |
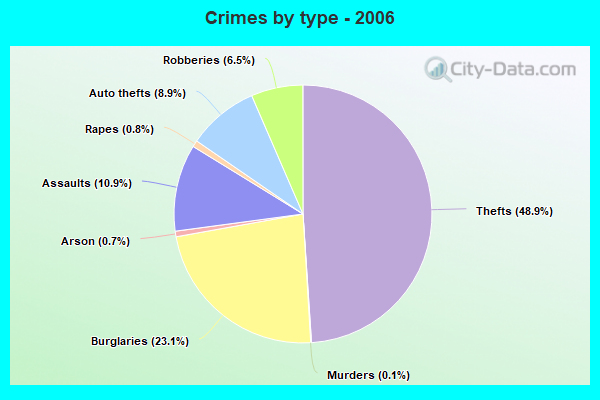
Property crime rate in 2006
| Syracuse: | 381.6 |
| U.S. Average: | 317.3 |
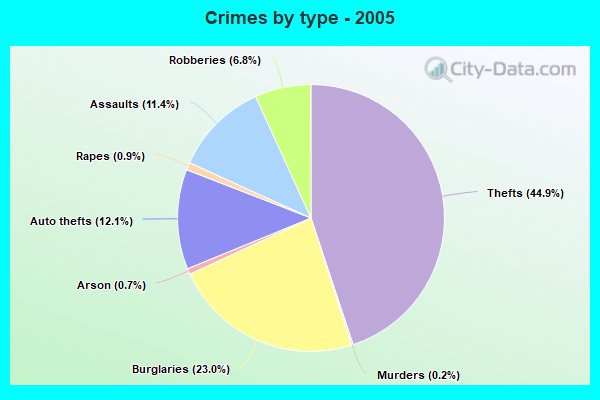
Property crime rate in 2005
| Syracuse: | 383.3 |
| U.S. Average: | 322.3 |
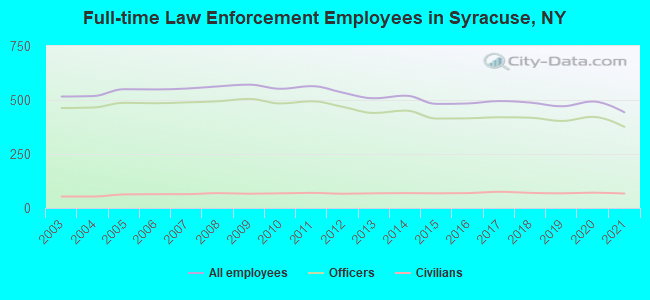
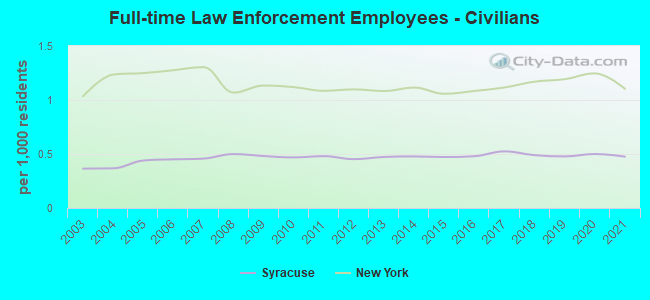
Full-time law enforcement employees in 2021, including police officers: 443 (376 officers - 314 male; 62 female).
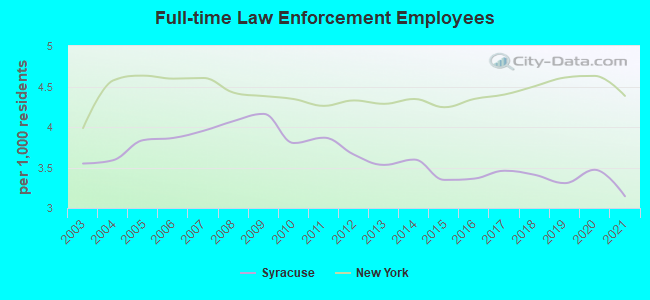
| Officers per 1,000 residents here: | 2.67 |
| New York average: | 3.28 |
Full-time law enforcement employees in 2020, including police officers: 493 (422 officers - 360 male; 62 female).
| Officers per 1,000 residents here: | 2.97 |
| New York average: | 3.38 |
Full-time law enforcement employees in 2019, including police officers: 471 (403 officers - 345 male; 58 female).
| Officers per 1,000 residents here: | 2.83 |
| New York average: | 3.42 |
Full-time law enforcement employees in 2018, including police officers: 488 (418 officers - 359 male; 59 female).
| Officers per 1,000 residents here: | 2.92 |
| New York average: | 3.33 |
Full-time law enforcement employees in 2017, including police officers: 495 (420 officers - 365 male; 55 female).
| Officers per 1,000 residents here: | 2.94 |
| New York average: | 3.28 |
Full-time law enforcement employees in 2016, including police officers: 484 (415 officers - 361 male; 54 female).
| Officers per 1,000 residents here: | 2.88 |
| New York average: | 3.26 |
Full-time law enforcement employees in 2015, including police officers: 482 (414 officers - 364 male; 50 female).
| Officers per 1,000 residents here: | 2.87 |
| New York average: | 3.19 |
Full-time law enforcement employees in 2014, including police officers: 520 (451 officers - 396 male; 55 female).
| Officers per 1,000 residents here: | 3.12 |
| New York average: | 3.23 |
Full-time law enforcement employees in 2013, including police officers: 508 (440 officers - 386 male; 54 female).
| Officers per 1,000 residents here: | 3.06 |
| New York average: | 3.20 |
Full-time law enforcement employees in 2012, including police officers: 534 (468 officers - 411 male; 57 female).
| Officers per 1,000 residents here: | 3.21 |
| New York average: | 3.23 |
Full-time law enforcement employees in 2011, including police officers: 564 (494 officers - 433 male; 61 female).
| Officers per 1,000 residents here: | 3.39 |
| New York average: | 3.18 |
Full-time law enforcement employees in 2010, including police officers: 552 (484 officers - 423 male; 61 female).
| Officers per 1,000 residents here: | 3.33 |
| New York average: | 3.23 |
Full-time law enforcement employees in 2009, including police officers: 571 (505 officers - 441 male; 64 female).
| Officers per 1,000 residents here: | 3.68 |
| New York average: | 3.25 |
Full-time law enforcement employees in 2008, including police officers: 563 (494 officers - 431 male; 63 female).
| Officers per 1,000 residents here: | 3.57 |
| New York average: | 3.36 |
Full-time law enforcement employees in 2007, including police officers: 553 (489 officers - 428 male; 61 female).
| Officers per 1,000 residents here: | 3.50 |
| New York average: | 3.30 |
Full-time law enforcement employees in 2006, including police officers: 549 (485 officers - 425 male; 60 female).
| Officers per 1,000 residents here: | 3.41 |
| New York average: | 3.32 |
Full-time law enforcement employees in 2005, including police officers: 550 (487 officers - 429 male; 58 female).
| Officers per 1,000 residents here: | 3.40 |
| New York average: | 3.39 |
Full-time law enforcement employees in 2004, including police officers: 518 (465 officers - 408 male; 57 female).
| Officers per 1,000 residents here: | 3.22 |
| New York average: | 3.34 |
Full-time law enforcement employees in 2003, including police officers: 516 (463 officers - 410 male; 53 female).
| Officers per 1,000 residents here: | 3.18 |
| New York average: | 2.95 |


Zip codes: 13202, 13203, 13207, 13210, 13214, 13215, 13224, 13290.