Crime rate in Stockton, California (CA): murders, rapes, robberies, assaults, burglaries, thefts, auto thefts, arson, law enforcement employees, police officers, crime map

Crime rate in Stockton, CA
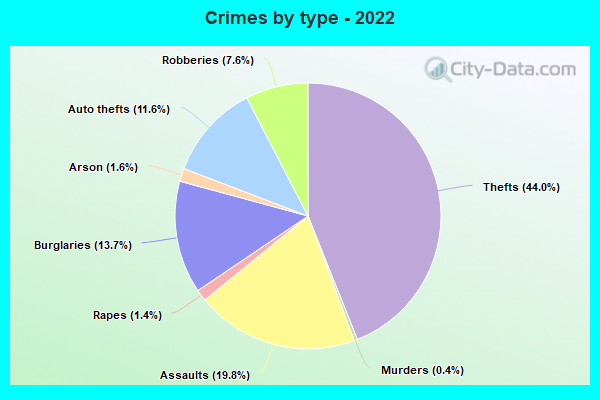
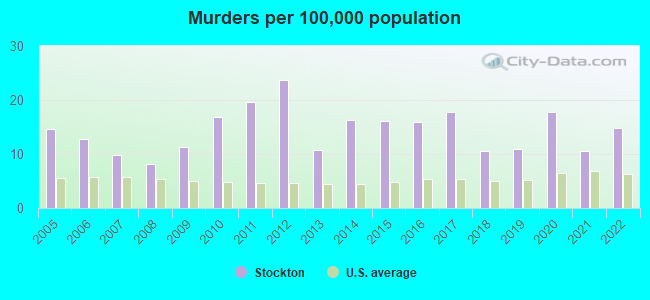
The 2022 crime rate in Stockton, CA is 466 (City-Data.com crime index), which is 1.9 times higher than the U.S. average. It was higher than in 96.0% U.S. cities. The 2022 Stockton crime rate rose by 20% compared to 2021. The number of homicides stood at 48 - an increase of 15 compared to 2021. In the last 5 years Stockton has seen decreasing violent crime and decline of property crime.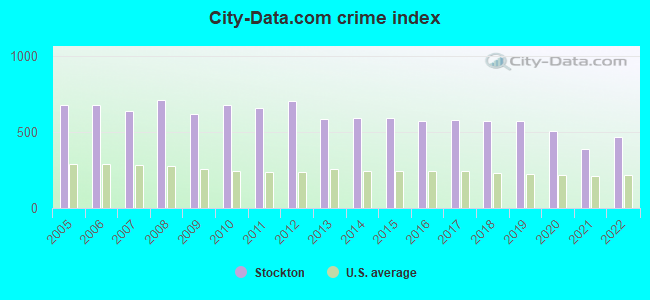
The City-Data.com crime index weighs serious crimes and violent crimes more heavily. Higher means more crime, U.S. average is 246.1. It adjusts for the number of visitors and daily workers commuting into cities.
- means the value is smaller than the state average.- means the value is about the same as the state average.
- means the value is bigger than the state average.
- means the value is much bigger than the state average.
According to our research of California and other state lists, there were 761 registered sex offenders living in Stockton, California as of May 17, 2024.
The ratio of all residents to sex offenders in Stockton is 403 to 1.
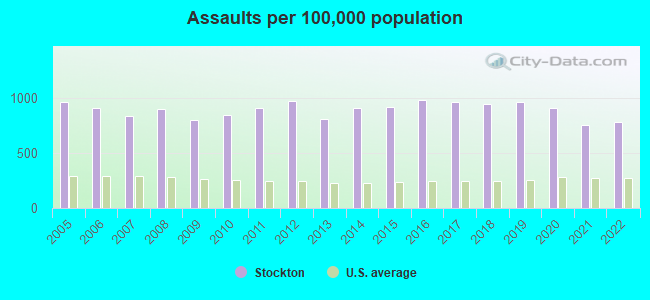
Violent crime rate in 2022
| Stockton: | 628.1 |
| U.S. Average: | 219.8 |
Violent crime rate in 2021
| Stockton: | 543.4 |
| U.S. Average: | 224.8 |
Violent crime rate in 2020
| Stockton: | 695.3 |
| U.S. Average: | 228.2 |
Violent crime rate in 2019
| Stockton: | 743.5 |
| U.S. Average: | 219.9 |
Violent crime rate in 2018
| Stockton: | 746.4 |
| U.S. Average: | 221.2 |
Violent crime rate in 2017
| Stockton: | 758.8 |
| U.S. Average: | 226.2 |
Violent crime rate in 2016
| Stockton: | 755.0 |
| U.S. Average: | 227.3 |
Violent crime rate in 2015
| Stockton: | 722.2 |
| U.S. Average: | 219.3 |
Violent crime rate in 2014
| Stockton: | 712.6 |
| U.S. Average: | 211.1 |
Violent crime rate in 2013
| Stockton: | 635.3 |
| U.S. Average: | 214.2 |
Violent crime rate in 2012
| Stockton: | 824.6 |
| U.S. Average: | 187.4 |
Violent crime rate in 2011
| Stockton: | 748.6 |
| U.S. Average: | 187.1 |
Violent crime rate in 2010
| Stockton: | 734.8 |
| U.S. Average: | 195.7 |
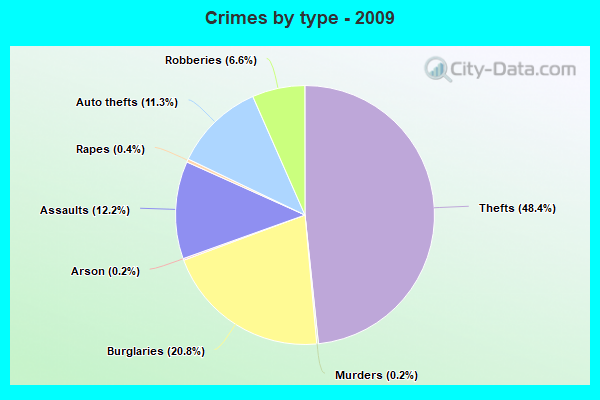
Violent crime rate in 2009
| Stockton: | 664.6 |
| U.S. Average: | 208.9 |
Violent crime rate in 2008
| Stockton: | 768.8 |
| U.S. Average: | 222.5 |
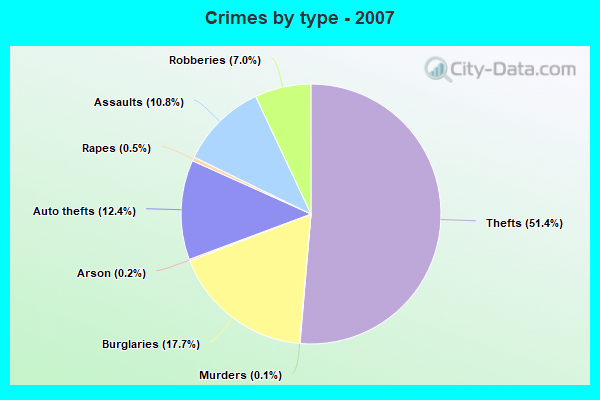
Violent crime rate in 2007
| Stockton: | 664.2 |
| U.S. Average: | 229.1 |
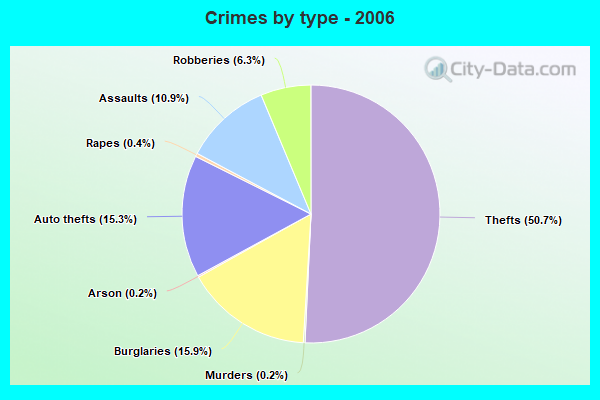
Violent crime rate in 2006
| Stockton: | 696.1 |
| U.S. Average: | 232.6 |
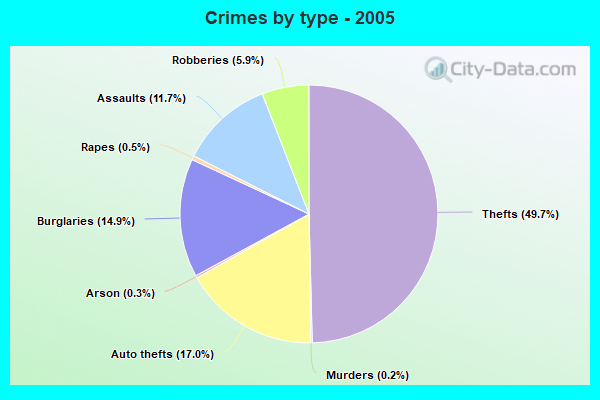
Violent crime rate in 2005
| Stockton: | 704.7 |
| U.S. Average: | 227.0 |
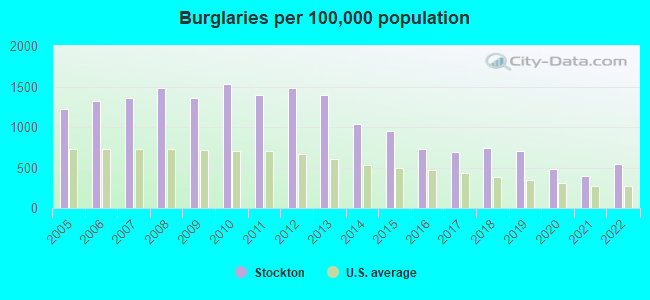
Property crime rate in 2022
| Stockton: | 264.6 |
| U.S. Average: | 166.5 |
Property crime rate in 2021
| Stockton: | 211.0 |
| U.S. Average: | 157.8 |
Property crime rate in 2020
| Stockton: | 269.6 |
| U.S. Average: | 169.6 |
Property crime rate in 2019
| Stockton: | 356.3 |
| U.S. Average: | 179.7 |
Property crime rate in 2018
| Stockton: | 365.6 |
| U.S. Average: | 190.2 |
Property crime rate in 2017
| Stockton: | 351.2 |
| U.S. Average: | 206.4 |
Property crime rate in 2016
| Stockton: | 357.6 |
| U.S. Average: | 216.6 |
Property crime rate in 2015
| Stockton: | 420.6 |
| U.S. Average: | 221.5 |
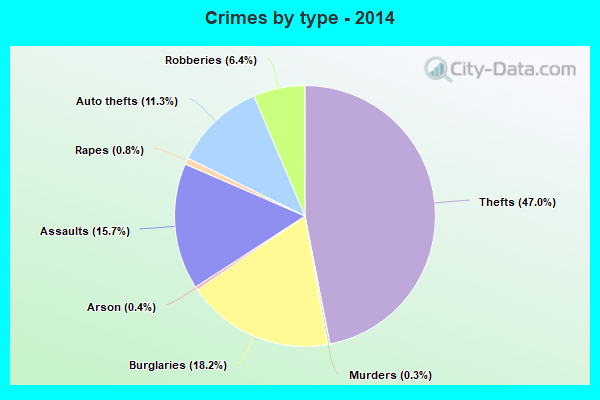
Property crime rate in 2014
| Stockton: | 440.8 |
| U.S. Average: | 230.8 |
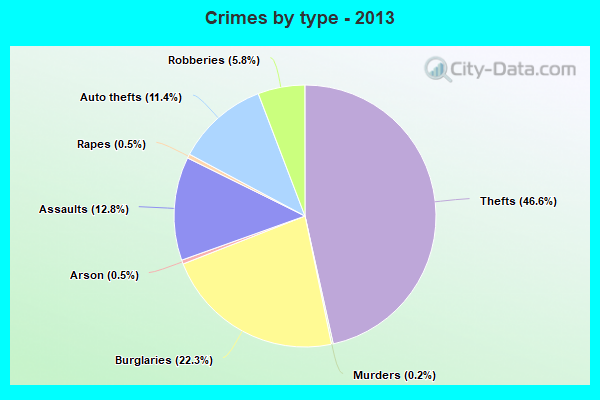
Property crime rate in 2013
| Stockton: | 532.6 |
| U.S. Average: | 250.4 |
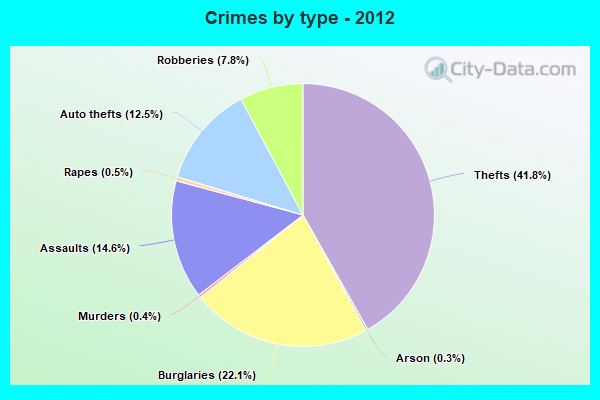
Property crime rate in 2012
| Stockton: | 560.2 |
| U.S. Average: | 267.3 |
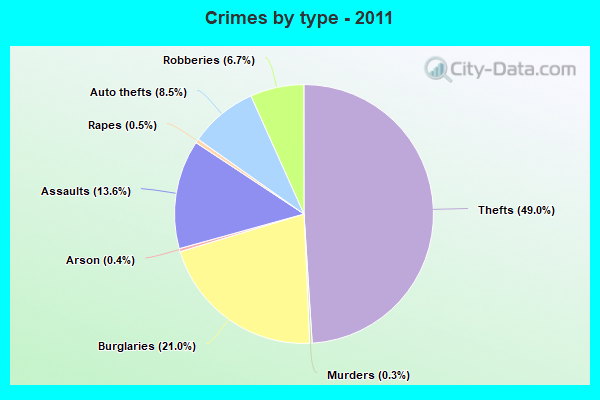
Property crime rate in 2011
| Stockton: | 528.9 |
| U.S. Average: | 273.5 |
Property crime rate in 2010
| Stockton: | 577.7 |
| U.S. Average: | 276.4 |
Property crime rate in 2009
| Stockton: | 542.6 |
| U.S. Average: | 285.6 |
Property crime rate in 2008
| Stockton: | 614.4 |
| U.S. Average: | 302.2 |
Property crime rate in 2007
| Stockton: | 550.3 |
| U.S. Average: | 309.2 |
Property crime rate in 2006
| Stockton: | 596.8 |
| U.S. Average: | 317.3 |
Property crime rate in 2005
| Stockton: | 588.7 |
| U.S. Average: | 322.3 |
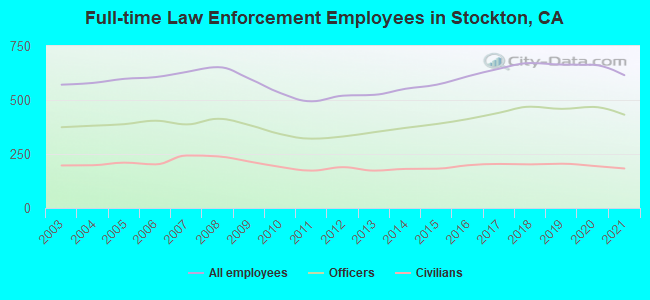
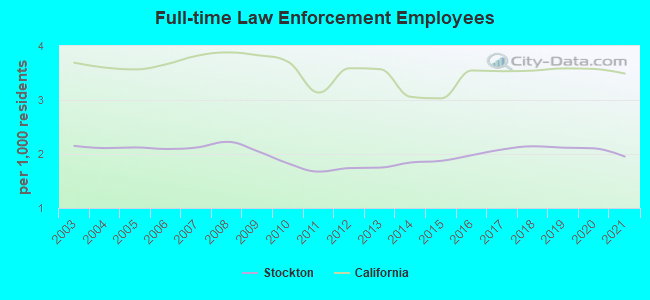
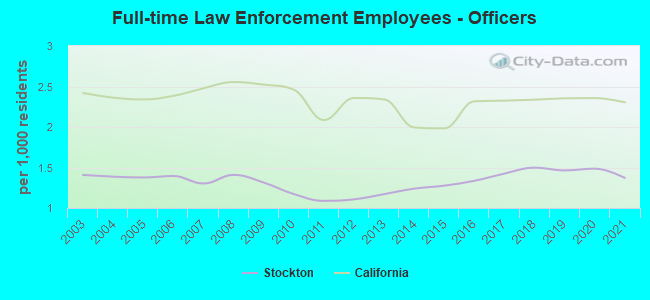
Full-time law enforcement employees in 2021, including police officers: 615 (432 officers - 384 male; 48 female).
| Officers per 1,000 residents here: | 1.37 |
| California average: | 2.30 |
Full-time law enforcement employees in 2020, including police officers: 663 (468 officers - 412 male; 56 female).
| Officers per 1,000 residents here: | 1.49 |
| California average: | 2.36 |
Full-time law enforcement employees in 2019, including police officers: 664 (459 officers - 411 male; 48 female).
| Officers per 1,000 residents here: | 1.46 |
| California average: | 2.35 |
Full-time law enforcement employees in 2018, including police officers: 671 (469 officers - 419 male; 50 female).
| Officers per 1,000 residents here: | 1.50 |
| California average: | 2.34 |
Full-time law enforcement employees in 2017, including police officers: 645 (441 officers - 397 male; 44 female).
| Officers per 1,000 residents here: | 1.42 |
| California average: | 2.32 |
Full-time law enforcement employees in 2016, including police officers: 610 (412 officers - 370 male; 42 female).
| Officers per 1,000 residents here: | 1.34 |
| California average: | 2.32 |
Full-time law enforcement employees in 2015, including police officers: 571 (389 officers - 348 male; 41 female).
| Officers per 1,000 residents here: | 1.28 |
| California average: | 1.98 |
Full-time law enforcement employees in 2014, including police officers: 552 (371 officers - 337 male; 34 female).
| Officers per 1,000 residents here: | 1.24 |
| California average: | 2.00 |
Full-time law enforcement employees in 2013, including police officers: 524 (351 officers - 316 male; 35 female).
| Officers per 1,000 residents here: | 1.17 |
| California average: | 2.34 |
Full-time law enforcement employees in 2012, including police officers: 520 (331 officers - 295 male; 36 female).
| Officers per 1,000 residents here: | 1.11 |
| California average: | 2.36 |
Full-time law enforcement employees in 2011, including police officers: 494 (321 officers - 291 male; 30 female).
| Officers per 1,000 residents here: | 1.09 |
| California average: | 2.09 |
Full-time law enforcement employees in 2010, including police officers: 532 (342 officers - 310 male; 32 female).
| Officers per 1,000 residents here: | 1.17 |
| California average: | 2.46 |
Full-time law enforcement employees in 2009, including police officers: 599 (384 officers - 349 male; 35 female).
| Officers per 1,000 residents here: | 1.31 |
| California average: | 2.52 |
Full-time law enforcement employees in 2008, including police officers: 652 (413 officers - 376 male; 37 female).
| Officers per 1,000 residents here: | 1.41 |
| California average: | 2.55 |
Full-time law enforcement employees in 2007, including police officers: 630 (387 officers - 350 male; 37 female).
| Officers per 1,000 residents here: | 1.30 |
| California average: | 2.48 |
Full-time law enforcement employees in 2006, including police officers: 606 (404 officers - 366 male; 38 female).
| Officers per 1,000 residents here: | 1.40 |
| California average: | 2.38 |
Full-time law enforcement employees in 2005, including police officers: 598 (388 officers - 352 male; 36 female).
| Officers per 1,000 residents here: | 1.38 |
| California average: | 2.34 |
Full-time law enforcement employees in 2004, including police officers: 579 (381 officers - 345 male; 36 female).
| Officers per 1,000 residents here: | 1.39 |
| California average: | 2.36 |
Full-time law enforcement employees in 2003, including police officers: 571 (374 officers - 339 male; 35 female).
| Officers per 1,000 residents here: | 1.41 |
| California average: | 2.42 |