Crime rate in Spokane, Washington (WA): murders, rapes, robberies, assaults, burglaries, thefts, auto thefts, arson, law enforcement employees, police officers, crime map
Crime rate in Spokane, WA
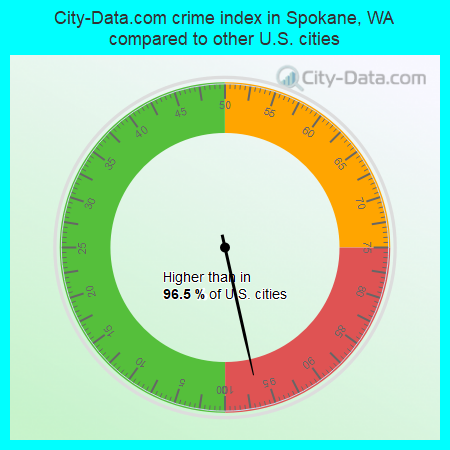
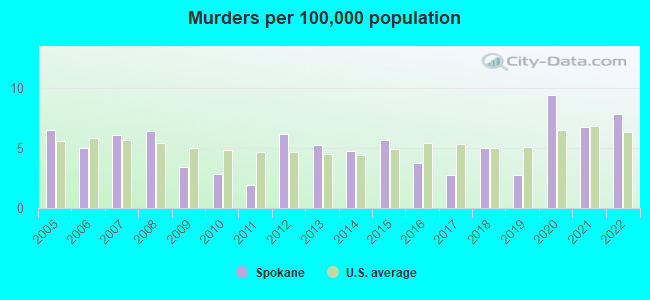
The 2022 crime rate in Spokane, WA is 497 (City-Data.com crime index), which is 2.0 times greater than the U.S. average. It was higher than in 96.5% U.S. cities. The 2022 Spokane crime rate rose by 10% compared to 2021. The number of homicides stood at 18 - an increase of 3 compared to 2021. In the last 5 years Spokane has seen decreasing violent crime and decline of property crime.See how dangerous Spokane, WA is compared to the nearest cities:
(Note: Higher means more crime)
(Note: Higher means more crime)
| Spokane: | 496.9 |
| Spokane Valley: | 305.3 |
| Airway Heights: | 315.5 |
| Cheney: | 177.5 |
| Liberty Lake: | 154.6 |
| Reardan: | 87.6 |
| Post Falls: | 105.9 |
| Rathdrum: | 9.1 |
| Coeur d'Alene: | 171.0 |
The City-Data.com crime index weighs serious crimes and violent crimes more heavily. Higher means more crime, U.S. average is 246.1. It adjusts for the number of visitors and daily workers commuting into cities.
- means the value is smaller than the state average.- means the value is about the same as the state average.
- means the value is bigger than the state average.
- means the value is much bigger than the state average.
According to our research of Washington and other state lists, there were 325 registered sex offenders living in Spokane, Washington as of May 22, 2024.
The ratio of all residents to sex offenders in Spokane is 665 to 1.
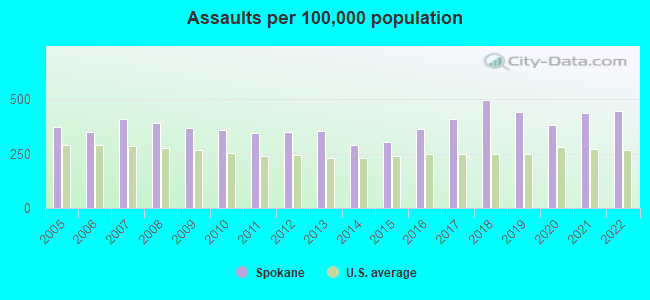
Violent crime rate in 2022
| Spokane: | 390.1 |
| U.S. Average: | 219.8 |
Violent crime rate in 2021
| Spokane: | 392.0 |
| U.S. Average: | 224.8 |
Violent crime rate in 2020
| Spokane: | 368.9 |
| U.S. Average: | 228.2 |
Violent crime rate in 2019
| Spokane: | 412.8 |
| U.S. Average: | 219.9 |
Violent crime rate in 2018
| Spokane: | 498.8 |
| U.S. Average: | 221.2 |
Violent crime rate in 2017
| Spokane: | 382.6 |
| U.S. Average: | 226.2 |
Violent crime rate in 2016
| Spokane: | 348.1 |
| U.S. Average: | 227.3 |
Violent crime rate in 2015
| Spokane: | 297.6 |
| U.S. Average: | 219.3 |
Violent crime rate in 2014
| Spokane: | 308.7 |
| U.S. Average: | 211.1 |
Violent crime rate in 2013
| Spokane: | 355.3 |
| U.S. Average: | 214.2 |
Violent crime rate in 2012
| Spokane: | 350.9 |
| U.S. Average: | 187.4 |
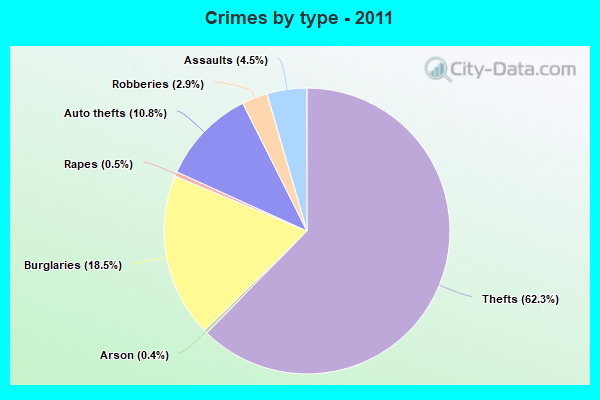
Violent crime rate in 2011
| Spokane: | 329.9 |
| U.S. Average: | 187.1 |
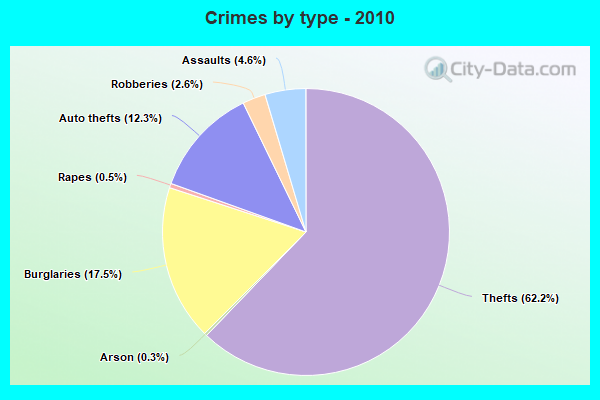
Violent crime rate in 2010
| Spokane: | 327.4 |
| U.S. Average: | 195.7 |
Violent crime rate in 2009
| Spokane: | 336.6 |
| U.S. Average: | 208.9 |
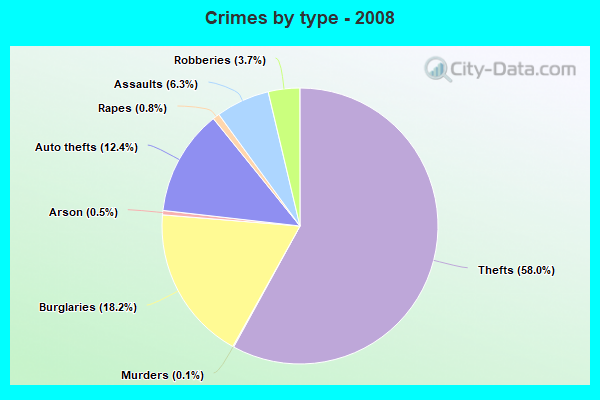
Violent crime rate in 2008
| Spokane: | 368.5 |
| U.S. Average: | 222.5 |
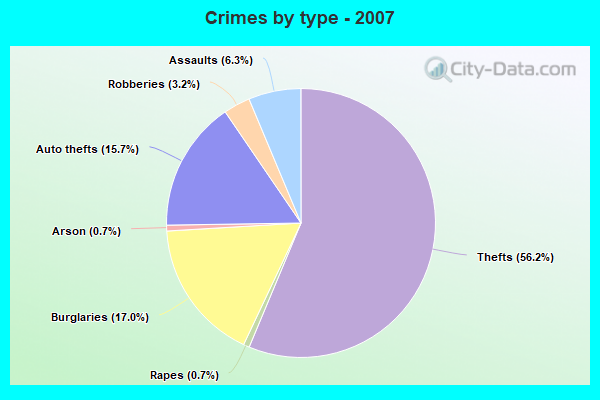
Violent crime rate in 2007
| Spokane: | 289.4 |
| U.S. Average: | 229.1 |
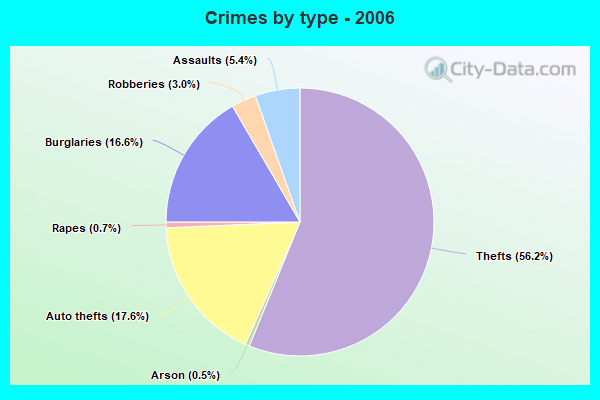
Violent crime rate in 2006
| Spokane: | 261.2 |
| U.S. Average: | 232.6 |
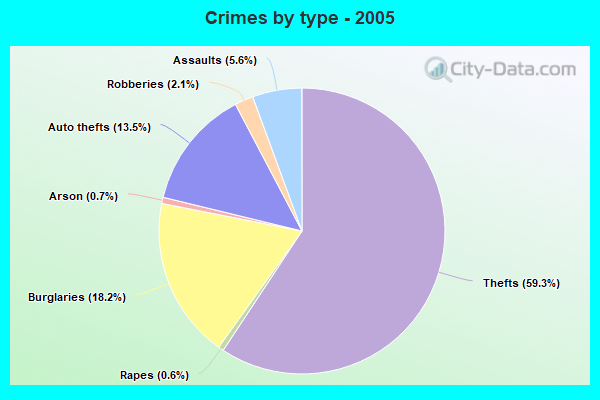
Violent crime rate in 2005
| Spokane: | 246.2 |
| U.S. Average: | 227.0 |
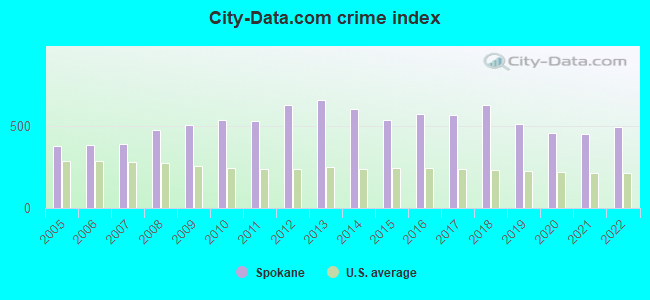
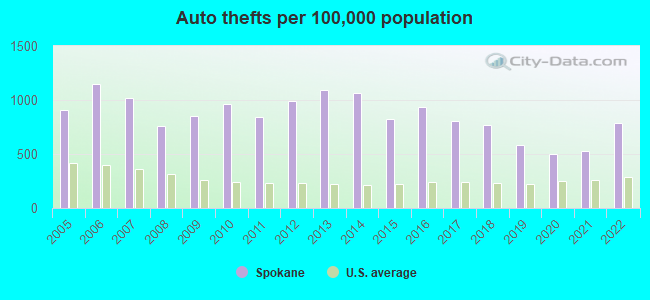
Property crime rate in 2022
| Spokane: | 481.3 |
| U.S. Average: | 166.5 |
Property crime rate in 2021
| Spokane: | 399.0 |
| U.S. Average: | 157.8 |
Property crime rate in 2020
| Spokane: | 426.7 |
| U.S. Average: | 169.6 |
Property crime rate in 2019
| Spokane: | 475.1 |
| U.S. Average: | 179.7 |
Property crime rate in 2018
| Spokane: | 579.2 |
| U.S. Average: | 190.2 |
Property crime rate in 2017
| Spokane: | 596.3 |
| U.S. Average: | 206.4 |
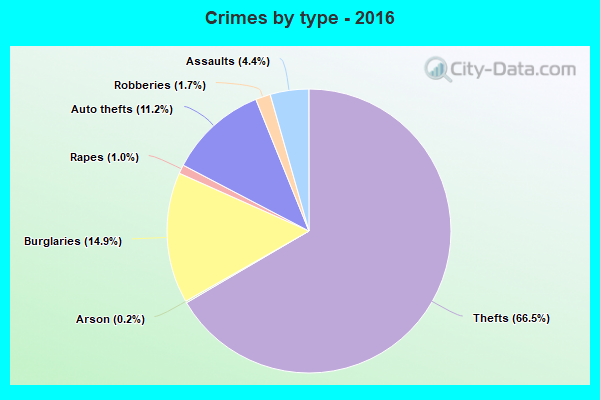
Property crime rate in 2016
| Spokane: | 663.2 |
| U.S. Average: | 216.6 |
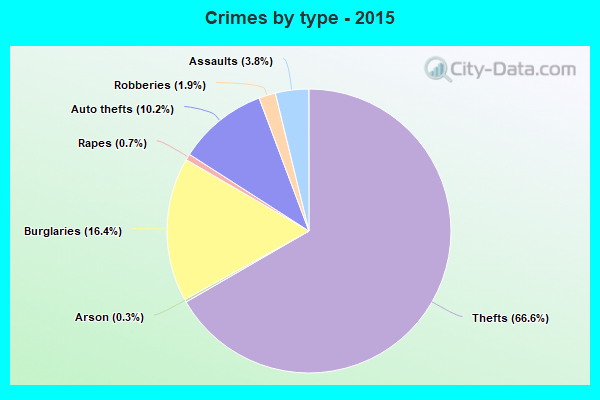
Property crime rate in 2015
| Spokane: | 656.2 |
| U.S. Average: | 221.5 |
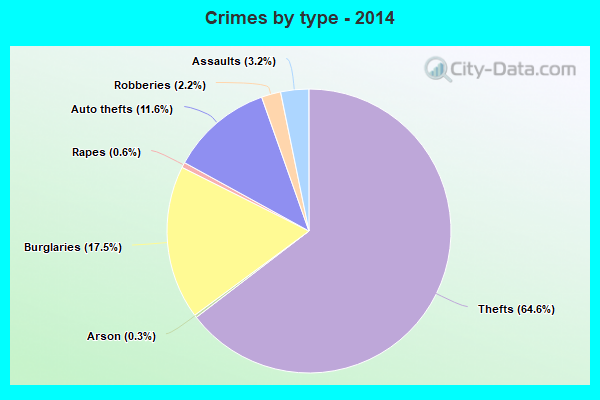
Property crime rate in 2014
| Spokane: | 773.4 |
| U.S. Average: | 230.8 |
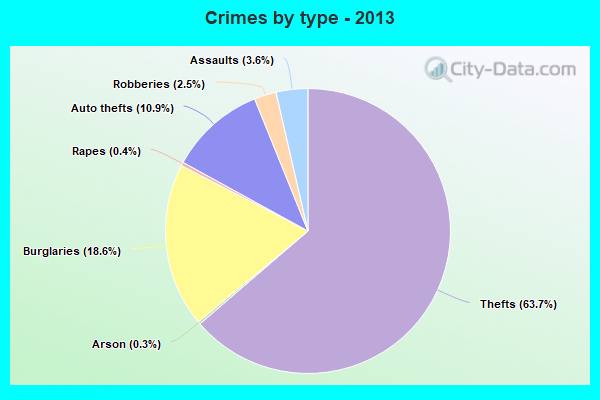
Property crime rate in 2013
| Spokane: | 853.8 |
| U.S. Average: | 250.4 |
Property crime rate in 2012
| Spokane: | 805.8 |
| U.S. Average: | 267.3 |
Property crime rate in 2011
| Spokane: | 652.4 |
| U.S. Average: | 273.5 |
Property crime rate in 2010
| Spokane: | 661.4 |
| U.S. Average: | 276.4 |
Property crime rate in 2009
| Spokane: | 599.6 |
| U.S. Average: | 285.6 |
Property crime rate in 2008
| Spokane: | 518.8 |
| U.S. Average: | 302.2 |
Property crime rate in 2007
| Spokane: | 438.8 |
| U.S. Average: | 309.2 |
Property crime rate in 2006
| Spokane: | 453.8 |
| U.S. Average: | 317.3 |
Property crime rate in 2005
| Spokane: | 459.3 |
| U.S. Average: | 322.3 |
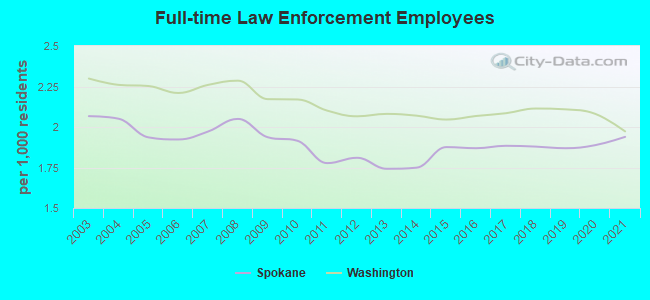
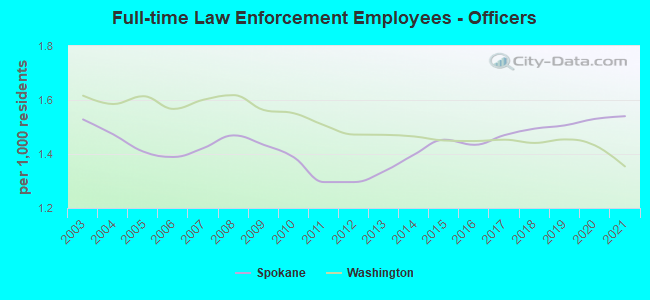
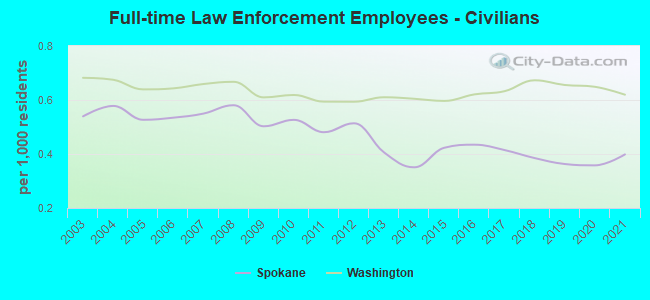
Full-time law enforcement employees in 2021, including police officers: 433 (344 officers - 316 male; 28 female).
| Officers per 1,000 residents here: | 1.54 |
| Washington average: | 1.35 |
Full-time law enforcement employees in 2020, including police officers: 422 (342 officers - 310 male; 32 female).
| Officers per 1,000 residents here: | 1.53 |
| Washington average: | 1.43 |
Full-time law enforcement employees in 2019, including police officers: 412 (332 officers - 302 male; 30 female).
| Officers per 1,000 residents here: | 1.51 |
| Washington average: | 1.45 |
Full-time law enforcement employees in 2018, including police officers: 410 (326 officers - 298 male; 28 female).
| Officers per 1,000 residents here: | 1.49 |
| Washington average: | 1.44 |
Full-time law enforcement employees in 2017, including police officers: 409 (319 officers - 287 male; 32 female).
| Officers per 1,000 residents here: | 1.47 |
| Washington average: | 1.45 |
Full-time law enforcement employees in 2016, including police officers: 400 (307 officers - 277 male; 30 female).
| Officers per 1,000 residents here: | 1.43 |
| Washington average: | 1.45 |
Full-time law enforcement employees in 2015, including police officers: 399 (309 officers - 276 male; 33 female).
| Officers per 1,000 residents here: | 1.45 |
| Washington average: | 1.45 |
Full-time law enforcement employees in 2014, including police officers: 369 (295 officers - 263 male; 32 female).
| Officers per 1,000 residents here: | 1.40 |
| Washington average: | 1.47 |
Full-time law enforcement employees in 2013, including police officers: 365 (280 officers - 251 male; 29 female).
| Officers per 1,000 residents here: | 1.34 |
| Washington average: | 1.47 |
Full-time law enforcement employees in 2012, including police officers: 384 (275 officers - 242 male; 33 female).
| Officers per 1,000 residents here: | 1.30 |
| Washington average: | 1.47 |
Full-time law enforcement employees in 2011, including police officers: 377 (275 officers - 241 male; 34 female).
| Officers per 1,000 residents here: | 1.30 |
| Washington average: | 1.51 |
Full-time law enforcement employees in 2010, including police officers: 400 (290 officers - 254 male; 36 female).
| Officers per 1,000 residents here: | 1.39 |
| Washington average: | 1.55 |
Full-time law enforcement employees in 2009, including police officers: 393 (291 officers - 255 male; 36 female).
| Officers per 1,000 residents here: | 1.43 |
| Washington average: | 1.56 |
Full-time law enforcement employees in 2008, including police officers: 413 (296 officers - 258 male; 38 female).
| Officers per 1,000 residents here: | 1.47 |
| Washington average: | 1.62 |
Full-time law enforcement employees in 2007, including police officers: 391 (282 officers - 246 male; 36 female).
| Officers per 1,000 residents here: | 1.42 |
| Washington average: | 1.60 |
Full-time law enforcement employees in 2006, including police officers: 385 (278 officers - 242 male; 36 female).
| Officers per 1,000 residents here: | 1.39 |
| Washington average: | 1.57 |
Full-time law enforcement employees in 2005, including police officers: 386 (281 officers - 245 male; 36 female).
| Officers per 1,000 residents here: | 1.41 |
| Washington average: | 1.61 |
Full-time law enforcement employees in 2004, including police officers: 408 (293 officers - 257 male; 36 female).
| Officers per 1,000 residents here: | 1.47 |
| Washington average: | 1.59 |
Full-time law enforcement employees in 2003, including police officers: 410 (303 officers - 269 male; 34 female).
| Officers per 1,000 residents here: | 1.53 |
| Washington average: | 1.62 |


Zip codes: 99026, 99201, 99202, 99203, 99204, 99205, 99207, 99223.