Crime rate in Salinas, California (CA): murders, rapes, robberies, assaults, burglaries, thefts, auto thefts, arson, law enforcement employees, police officers, crime map
Crime rate in Salinas, CA
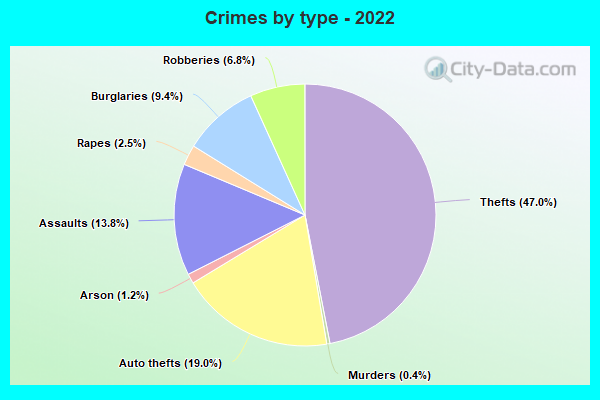
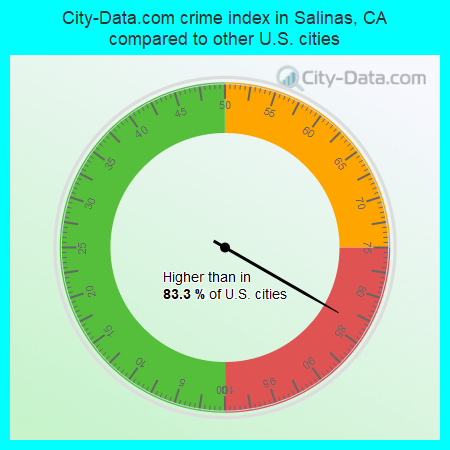
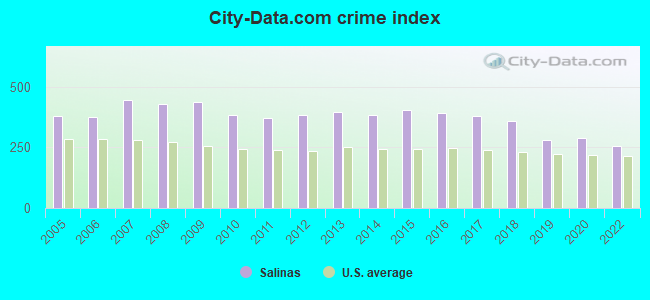
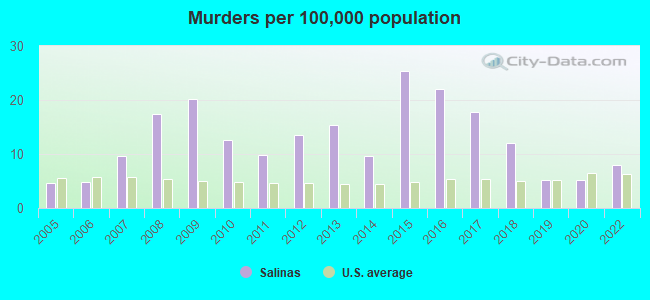
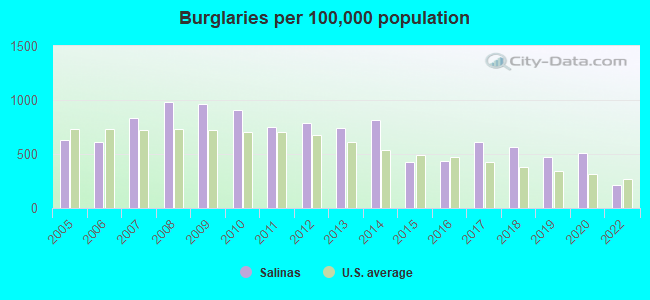
The 2022 crime rate in Salinas, CA is 258 (City-Data.com crime index), which is about the average for the U.S. cities. It was higher than in 83.3% U.S. cities. The 2022 Salinas crime rate fell by 11% compared to 2020. The number of homicides stood at 13 - an increase of 5 compared to 2020. In the last 5 years Salinas has seen decline of violent crime and decreasing property crime.See how dangerous Salinas, CA is compared to the nearest cities:
(Note: Higher means more crime)
(Note: Higher means more crime)
| Salinas: | 257.7 |
| Marina: | 200.5 |
| Seaside: | 170.2 |
| Sand City: | 1,680.6 |
| Del Rey Oaks: | 267.2 |
| Monterey: | 217.5 |
| Pacific Grove: | 52.7 |
| Gonzales: | 127.1 |
| Carmel: | 168.1 |
The City-Data.com crime index weighs serious crimes and violent crimes more heavily. Higher means more crime, U.S. average is 246.1. It adjusts for the number of visitors and daily workers commuting into cities.
- means the value is smaller than the state average.- means the value is about the same as the state average.
- means the value is bigger than the state average.
- means the value is much bigger than the state average.
According to our research of California and other state lists, there were 326 registered sex offenders living in Salinas, California as of May 02, 2024.
The ratio of all residents to sex offenders in Salinas is 482 to 1.

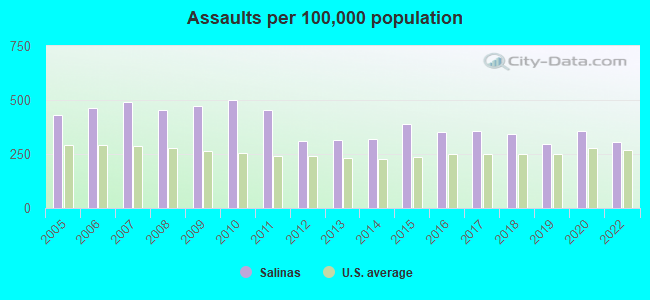
Violent crime rate in 2022
| Salinas: | 300.6 |
| U.S. Average: | 219.8 |
Violent crime rate in 2020
| Salinas: | 307.4 |
| U.S. Average: | 228.2 |
Violent crime rate in 2019
| Salinas: | 277.8 |
| U.S. Average: | 219.9 |
Violent crime rate in 2018
| Salinas: | 358.8 |
| U.S. Average: | 221.2 |
Violent crime rate in 2017
| Salinas: | 371.4 |
| U.S. Average: | 226.2 |
Violent crime rate in 2016
| Salinas: | 376.7 |
| U.S. Average: | 227.3 |
Violent crime rate in 2015
| Salinas: | 409.0 |
| U.S. Average: | 219.3 |
Violent crime rate in 2014
| Salinas: | 342.2 |
| U.S. Average: | 211.1 |
Violent crime rate in 2013
| Salinas: | 356.0 |
| U.S. Average: | 214.2 |
Violent crime rate in 2012
| Salinas: | 366.2 |
| U.S. Average: | 187.4 |
Violent crime rate in 2011
| Salinas: | 392.2 |
| U.S. Average: | 187.1 |
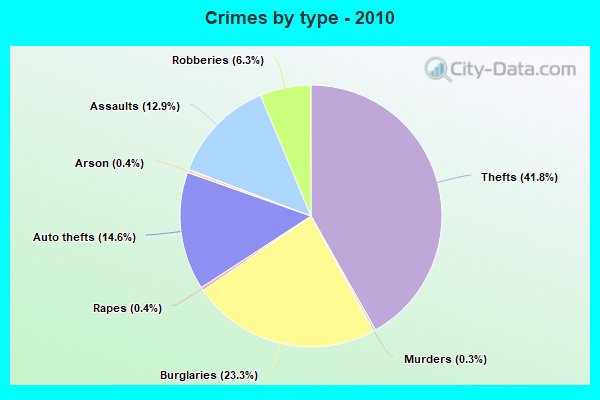
Violent crime rate in 2010
| Salinas: | 412.8 |
| U.S. Average: | 195.7 |
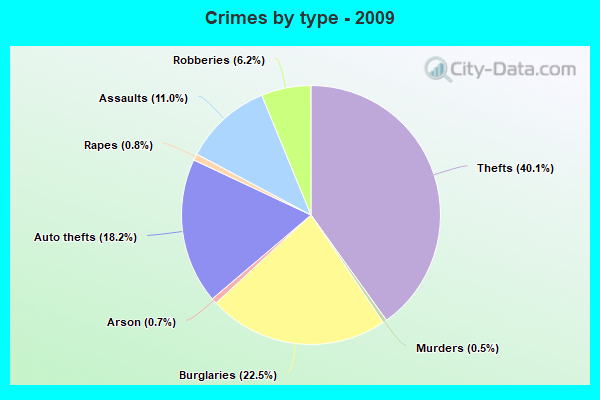
Violent crime rate in 2009
| Salinas: | 441.0 |
| U.S. Average: | 208.9 |
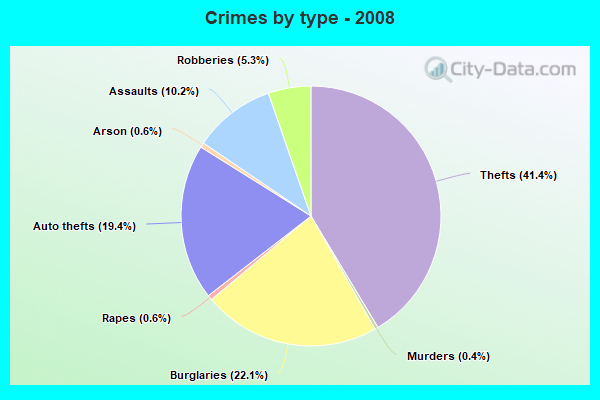
Violent crime rate in 2008
| Salinas: | 405.2 |
| U.S. Average: | 222.5 |
Violent crime rate in 2007
| Salinas: | 382.0 |
| U.S. Average: | 229.1 |
Violent crime rate in 2006
| Salinas: | 356.6 |
| U.S. Average: | 232.6 |
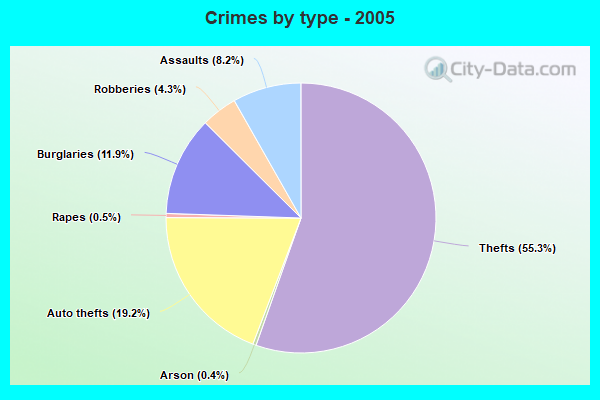
Violent crime rate in 2005
| Salinas: | 326.3 |
| U.S. Average: | 227.0 |
Property crime rate in 2022
| Salinas: | 157.5 |
| U.S. Average: | 166.5 |
Property crime rate in 2020
| Salinas: | 246.0 |
| U.S. Average: | 169.6 |
Property crime rate in 2019
| Salinas: | 252.3 |
| U.S. Average: | 179.7 |
Property crime rate in 2018
| Salinas: | 297.9 |
| U.S. Average: | 190.2 |
Property crime rate in 2017
| Salinas: | 321.2 |
| U.S. Average: | 206.4 |
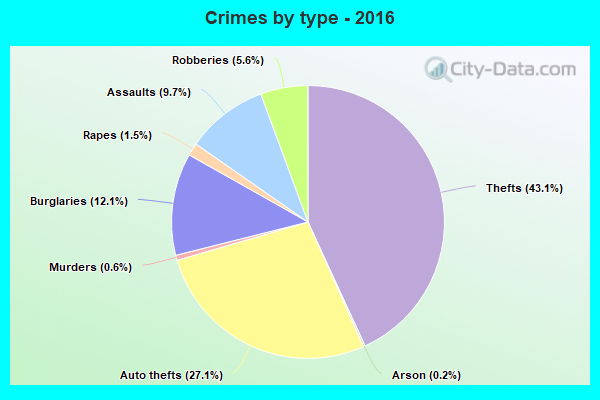
Property crime rate in 2016
| Salinas: | 313.5 |
| U.S. Average: | 216.6 |
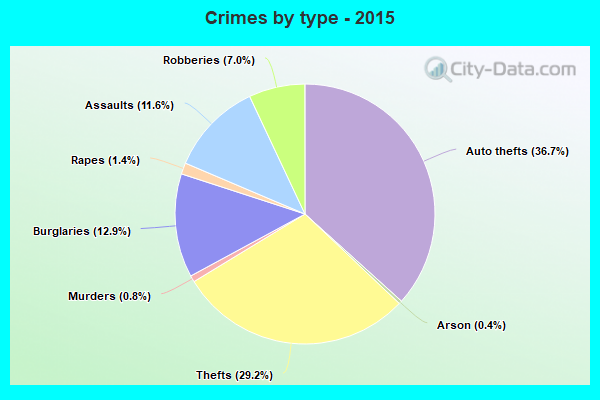
Property crime rate in 2015
| Salinas: | 317.5 |
| U.S. Average: | 221.5 |
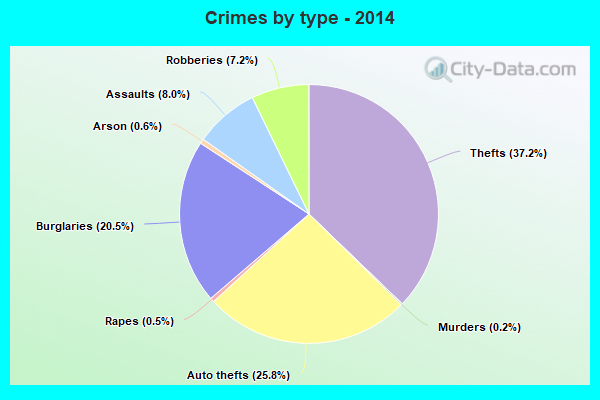
Property crime rate in 2014
| Salinas: | 392.0 |
| U.S. Average: | 230.8 |
Property crime rate in 2013
| Salinas: | 378.1 |
| U.S. Average: | 250.4 |
Property crime rate in 2012
| Salinas: | 347.3 |
| U.S. Average: | 267.3 |
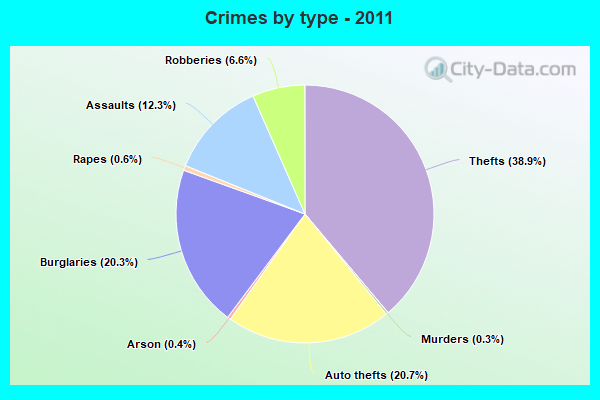
Property crime rate in 2011
| Salinas: | 336.3 |
| U.S. Average: | 273.5 |
Property crime rate in 2010
| Salinas: | 346.6 |
| U.S. Average: | 276.4 |
Property crime rate in 2009
| Salinas: | 395.2 |
| U.S. Average: | 285.6 |
Property crime rate in 2008
| Salinas: | 418.8 |
| U.S. Average: | 302.2 |
Property crime rate in 2007
| Salinas: | 464.9 |
| U.S. Average: | 309.2 |
Property crime rate in 2006
| Salinas: | 347.5 |
| U.S. Average: | 317.3 |
Property crime rate in 2005
| Salinas: | 375.6 |
| U.S. Average: | 322.3 |


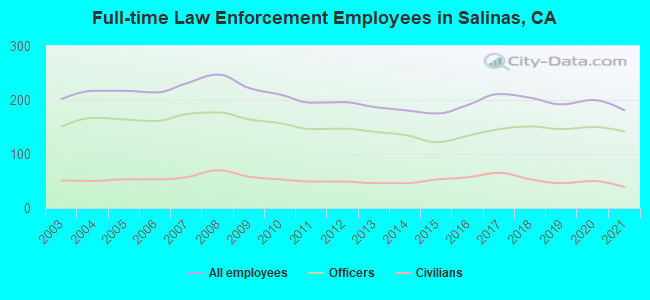
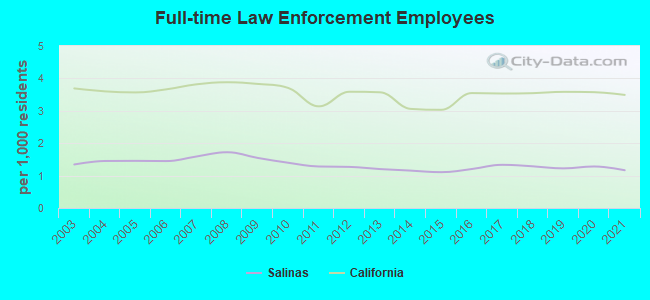
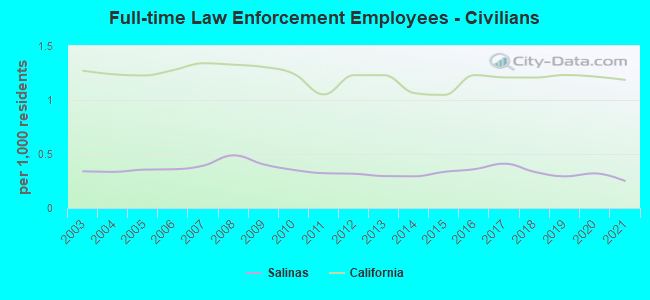
Full-time law enforcement employees in 2021, including police officers: 181 (142 officers - 128 male; 14 female).
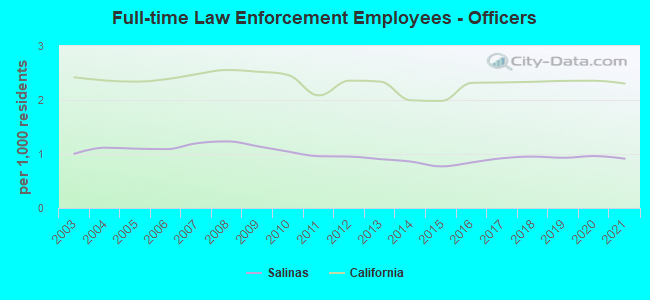
| Officers per 1,000 residents here: | 0.91 |
| California average: | 2.30 |
Full-time law enforcement employees in 2020, including police officers: 200 (150 officers - 135 male; 15 female).
| Officers per 1,000 residents here: | 0.96 |
| California average: | 2.36 |
Full-time law enforcement employees in 2019, including police officers: 192 (146 officers - 130 male; 16 female).
| Officers per 1,000 residents here: | 0.93 |
| California average: | 2.35 |
Full-time law enforcement employees in 2018, including police officers: 204 (151 officers - 136 male; 15 female).
| Officers per 1,000 residents here: | 0.95 |
| California average: | 2.34 |
Full-time law enforcement employees in 2017, including police officers: 211 (146 officers - 136 male; 10 female).
| Officers per 1,000 residents here: | 0.92 |
| California average: | 2.32 |
Full-time law enforcement employees in 2016, including police officers: 191 (134 officers - 127 male; 7 female).
| Officers per 1,000 residents here: | 0.84 |
| California average: | 2.32 |
Full-time law enforcement employees in 2015, including police officers: 175 (122 officers - 114 male; 8 female).
| Officers per 1,000 residents here: | 0.77 |
| California average: | 1.98 |
Full-time law enforcement employees in 2014, including police officers: 181 (135 officers - 127 male; 8 female).
| Officers per 1,000 residents here: | 0.86 |
| California average: | 2.00 |
Full-time law enforcement employees in 2013, including police officers: 187 (141 officers - 133 male; 8 female).
| Officers per 1,000 residents here: | 0.91 |
| California average: | 2.34 |
Full-time law enforcement employees in 2012, including police officers: 196 (147 officers - 138 male; 9 female).
| Officers per 1,000 residents here: | 0.95 |
| California average: | 2.36 |
Full-time law enforcement employees in 2011, including police officers: 195 (146 officers - 138 male; 8 female).
| Officers per 1,000 residents here: | 0.96 |
| California average: | 2.09 |
Full-time law enforcement employees in 2010, including police officers: 210 (157 officers - 145 male; 12 female).
| Officers per 1,000 residents here: | 1.04 |
| California average: | 2.46 |
Full-time law enforcement employees in 2009, including police officers: 222 (164 officers - 150 male; 14 female).
| Officers per 1,000 residents here: | 1.14 |
| California average: | 2.52 |
Full-time law enforcement employees in 2008, including police officers: 247 (177 officers - 161 male; 16 female).
| Officers per 1,000 residents here: | 1.23 |
| California average: | 2.55 |
Full-time law enforcement employees in 2007, including police officers: 231 (174 officers - 159 male; 15 female).
| Officers per 1,000 residents here: | 1.20 |
| California average: | 2.48 |
Full-time law enforcement employees in 2006, including police officers: 214 (161 officers - 146 male; 15 female).
| Officers per 1,000 residents here: | 1.09 |
| California average: | 2.38 |
Full-time law enforcement employees in 2005, including police officers: 217 (164 officers - 150 male; 14 female).
| Officers per 1,000 residents here: | 1.10 |
| California average: | 2.34 |
Full-time law enforcement employees in 2004, including police officers: 217 (167 officers - 151 male; 16 female).
| Officers per 1,000 residents here: | 1.12 |
| California average: | 2.36 |
Full-time law enforcement employees in 2003, including police officers: 202 (151 officers - 139 male; 12 female).
| Officers per 1,000 residents here: | 1.00 |
| California average: | 2.42 |