Crime rate in Port Orford, Oregon (OR): murders, rapes, robberies, assaults, burglaries, thefts, auto thefts, arson, law enforcement employees, police officers, crime map
Crime rate in Port Orford, OR
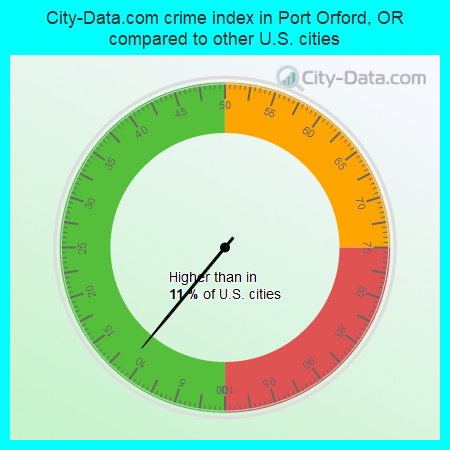
The 2018 crime rate in Port Orford, OR is 13 (City-Data.com crime index), which is 18.8 times lower than the U.S. average. It was higher than in 11.0% U.S. cities. The 2018 Port Orford crime rate fell by 84% compared to 2012.See how dangerous Port Orford, OR is compared to the nearest cities:
(Note: Higher means more crime)
(Note: Higher means more crime)
| Port Orford: | 13.1 |
| Gold Beach: | 136.0 |
| Bandon: | 87.1 |
| Myrtle Point: | 28.6 |
| Coquille: | 148.2 |
| Coos Bay: | 483.8 |
| North Bend: | 236.0 |
| Brookings: | 201.3 |
| Winston: | 113.0 |
Type |
2010 |
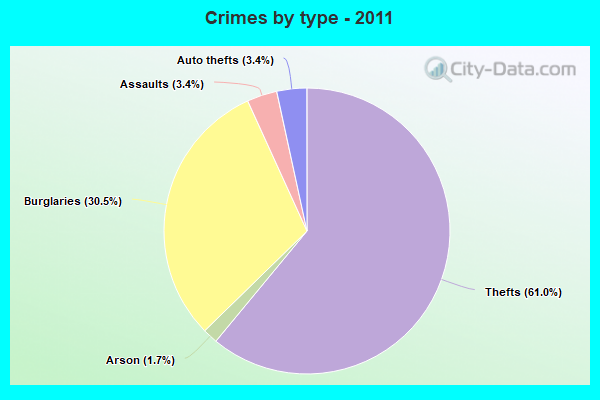
2011 |
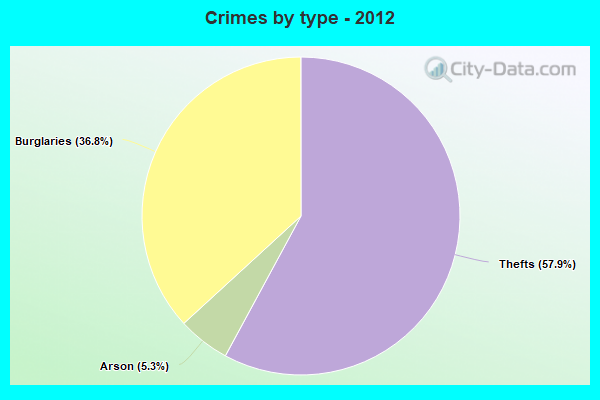
2012 |
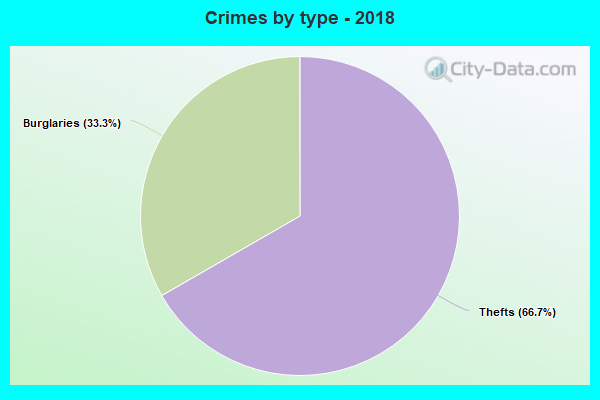
2018 |
|---|---|---|---|---|
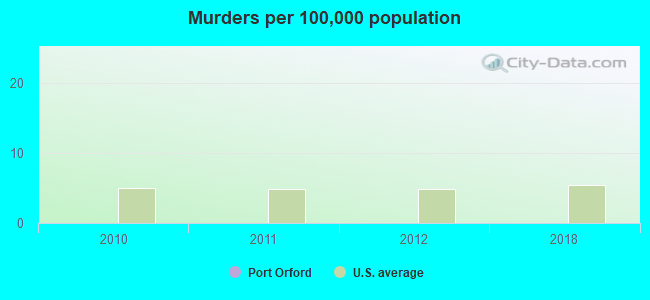
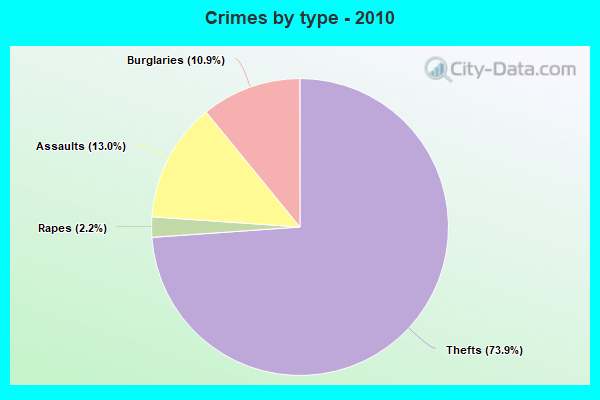
| Murders (per 100,000) | 0 (0.0) | 0 (0.0) | 0 (0.0) | 0 (0.0) |
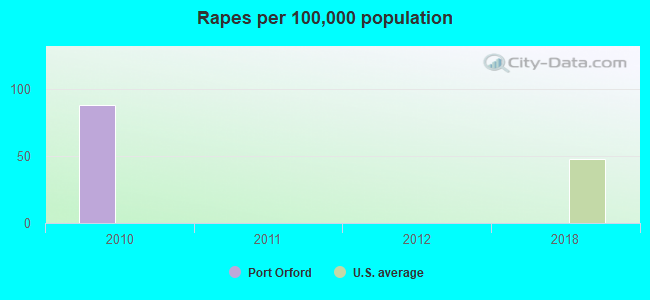
| Rapes (per 100,000) | 1 (88.3) | 0 (0.0) | 0 (0.0) | 0 (0.0) |
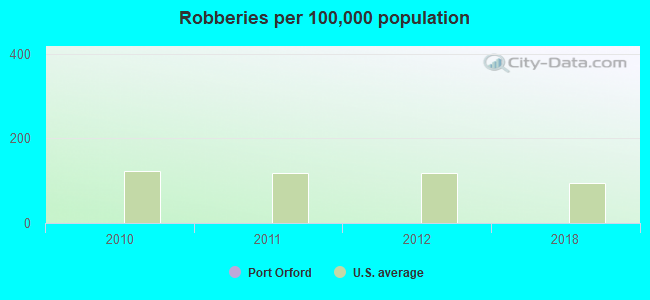
| Robberies (per 100,000) | 0 (0.0) | 0 (0.0) | 0 (0.0) | 0 (0.0) |
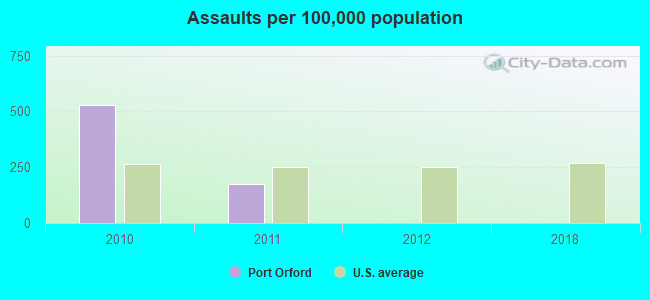
| Assaults (per 100,000) | 6 (529.6) | 2 (174.7) | 0 (0.0) | 0 (0.0) |
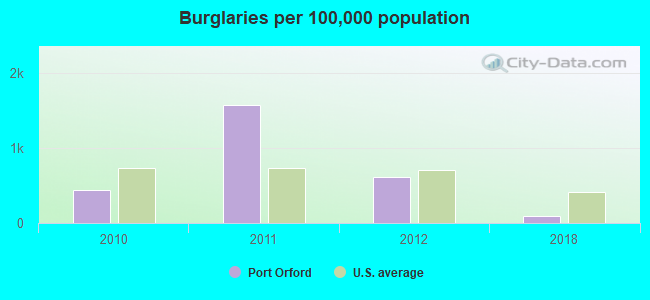
| Burglaries (per 100,000) | 5 (441.3) | 18 (1,572) | 7 (612.4) | 1 (87.5) |
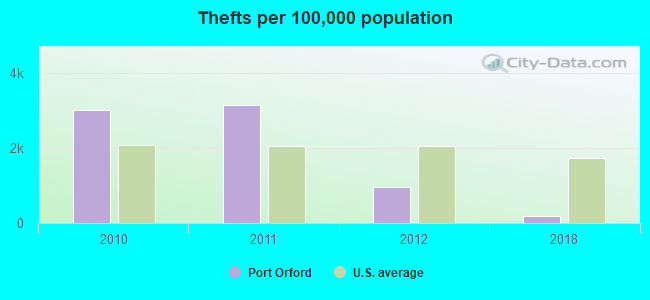
| Thefts (per 100,000) | 34 (3,001) | 36 (3,144) | 11 (962.4) | 2 (175.0) |
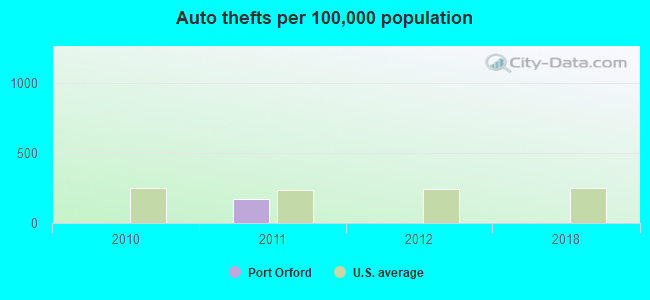
| Auto thefts (per 100,000) | 0 (0.0) | 2 (174.7) | 0 (0.0) | 0 (0.0) |
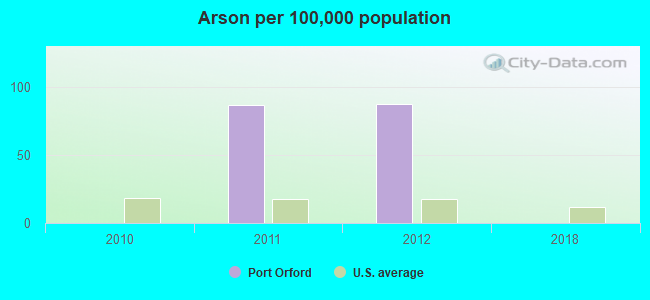
| Arson (per 100,000) | 0 (0.0) | 1 (87.3) | 1 (87.5) | 0 (0.0) |
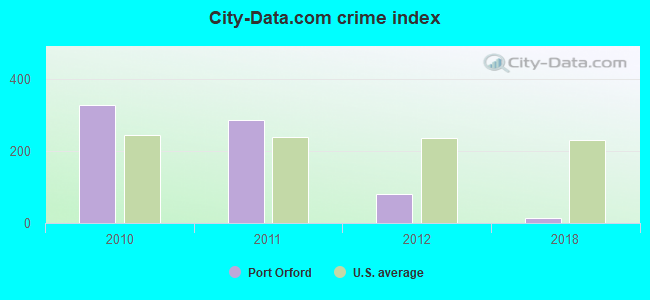
| City-Data.com crime index | 327.4 | 284.7 | 81.4 | 13.1 |
The City-Data.com crime index weighs serious crimes and violent crimes more heavily. Higher means more crime, U.S. average is 246.1. It adjusts for the number of visitors and daily workers commuting into cities.
Violent crime rate in 2018
| Port Orford: | 0.0 |
| U.S. Average: | 221.2 |
Violent crime rate in 2012
| Port Orford: | 0.0 |
| U.S. Average: | 187.4 |
Violent crime rate in 2011
| Port Orford: | 87.3 |
| U.S. Average: | 187.1 |
Violent crime rate in 2010
| Port Orford: | 353.0 |
| U.S. Average: | 195.7 |
Property crime rate in 2018
| Port Orford: | 26.2 |
| U.S. Average: | 190.2 |
Property crime rate in 2012
| Port Orford: | 170.6 |
| U.S. Average: | 267.3 |
Property crime rate in 2011
| Port Orford: | 497.8 |
| U.S. Average: | 273.5 |
Property crime rate in 2010
| Port Orford: | 238.3 |
| U.S. Average: | 276.4 |
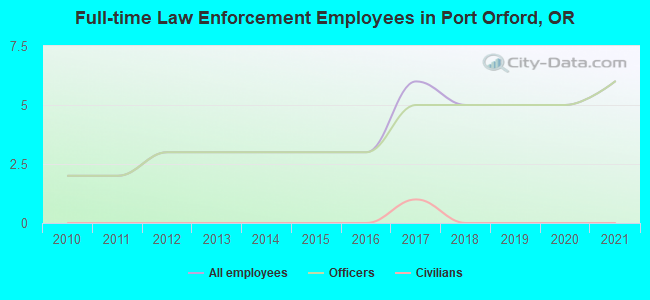
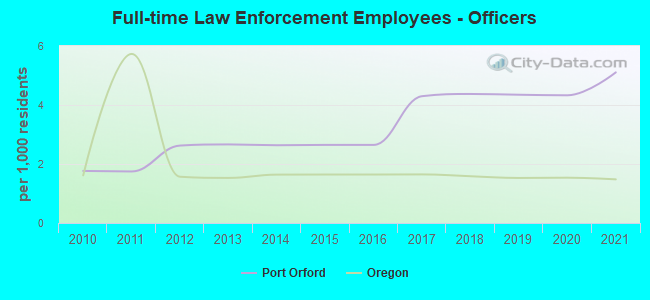
Full-time law enforcement employees in 2021, including police officers: 6 (6 officers - 6 male; 0 female).
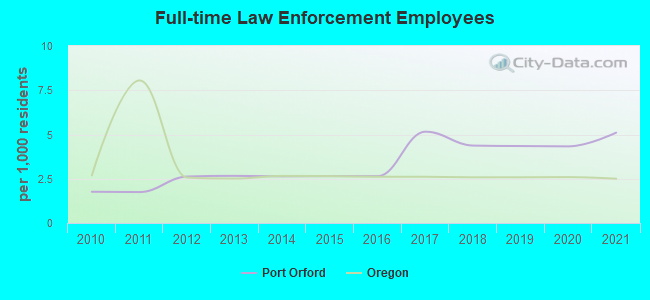
| Officers per 1,000 residents here: | 5.11 |
| Oregon average: | 1.48 |
Full-time law enforcement employees in 2020, including police officers: 5 (5 officers - 5 male; 0 female).
| Officers per 1,000 residents here: | 4.33 |
| Oregon average: | 1.54 |
Full-time law enforcement employees in 2019, including police officers: 5 (5 officers - 5 male; 0 female).
| Officers per 1,000 residents here: | 4.35 |
| Oregon average: | 1.53 |
Full-time law enforcement employees in 2018, including police officers: 5 (5 officers - 5 male; 0 female).
| Officers per 1,000 residents here: | 4.37 |
| Oregon average: | 1.59 |
Full-time law enforcement employees in 2017, including police officers: 6 (5 officers - 5 male; 0 female).
| Officers per 1,000 residents here: | 4.30 |
| Oregon average: | 1.65 |
Full-time law enforcement employees in 2015, including police officers: 3 (3 officers - 3 male; 0 female).
| Officers per 1,000 residents here: | 2.65 |
| Oregon average: | 1.64 |
Full-time law enforcement employees in 2014, including police officers: 3 (3 officers - 3 male; 0 female).
| Officers per 1,000 residents here: | 2.64 |
| Oregon average: | 1.64 |
Full-time law enforcement employees in 2013, including police officers: 3 (3 officers - 3 male; 0 female).
| Officers per 1,000 residents here: | 2.66 |
| Oregon average: | 1.53 |
Full-time law enforcement employees in 2012, including police officers: 3 (3 officers - 3 male; 0 female).
| Officers per 1,000 residents here: | 2.62 |
| Oregon average: | 1.57 |
Full-time law enforcement employees in 2011, including police officers: 2 (2 officers - 2 male; 0 female).
| Officers per 1,000 residents here: | 1.75 |
| Oregon average: | 5.73 |
Full-time law enforcement employees in 2010, including police officers: 2 (2 officers - 2 male; 0 female).
| Officers per 1,000 residents here: | 1.77 |
| Oregon average: | 1.62 |
Zip codes: 97465.