Crime rate in Pearland, Texas (TX): murders, rapes, robberies, assaults, burglaries, thefts, auto thefts, arson, law enforcement employees, police officers, crime map
Crime rate in Pearland, TX
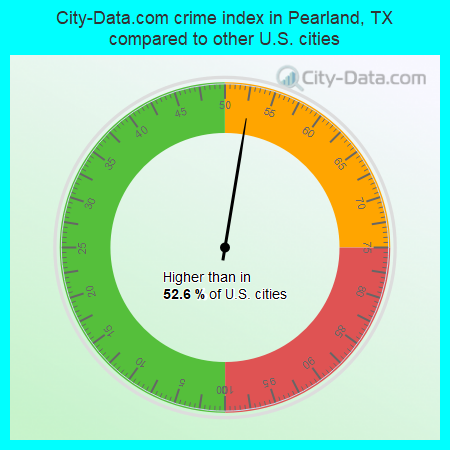
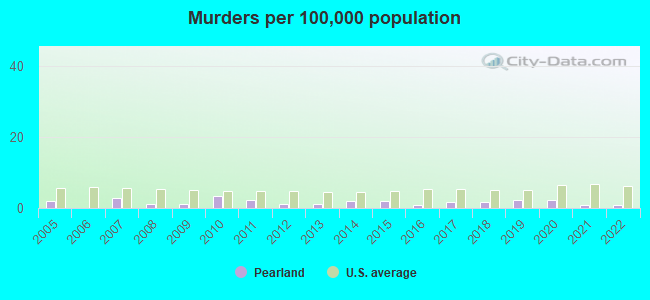
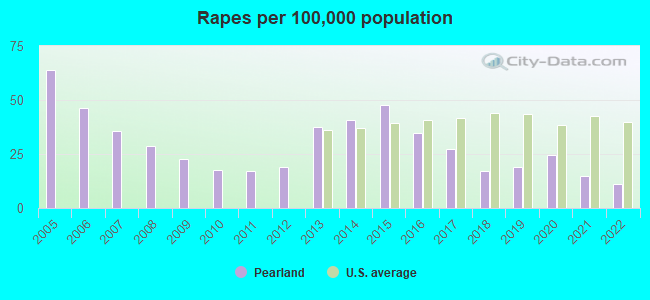
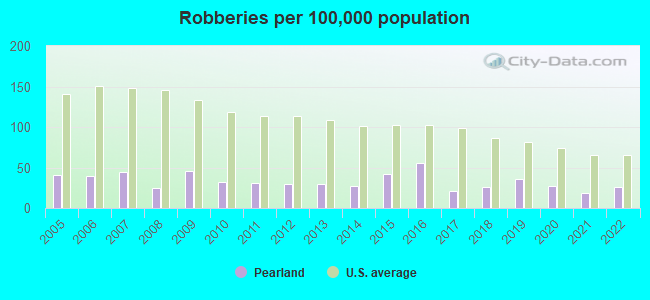
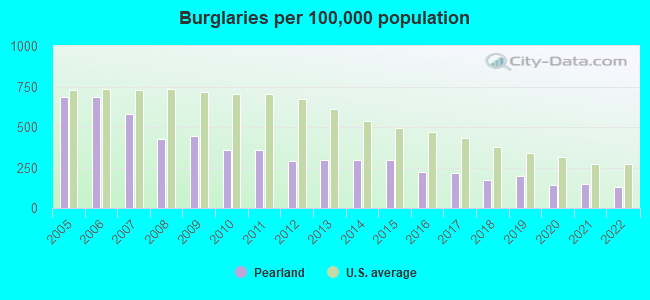
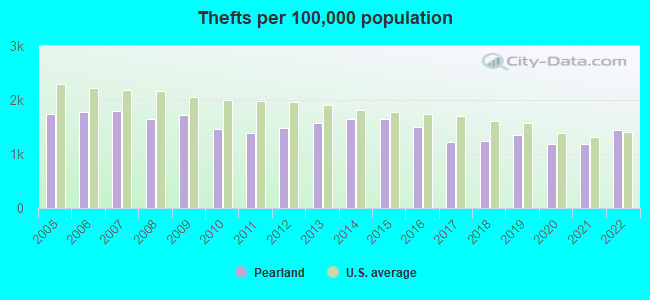
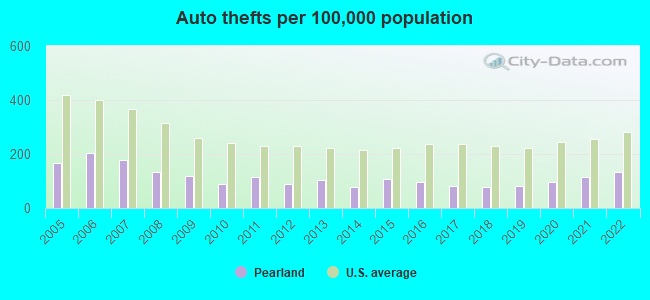
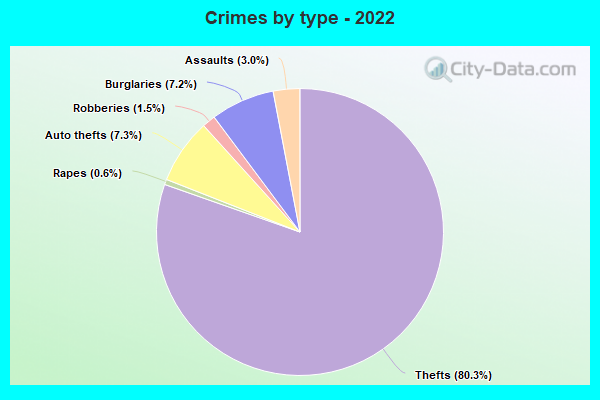
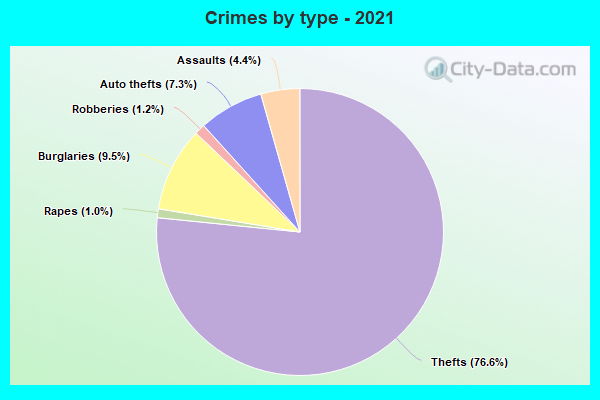
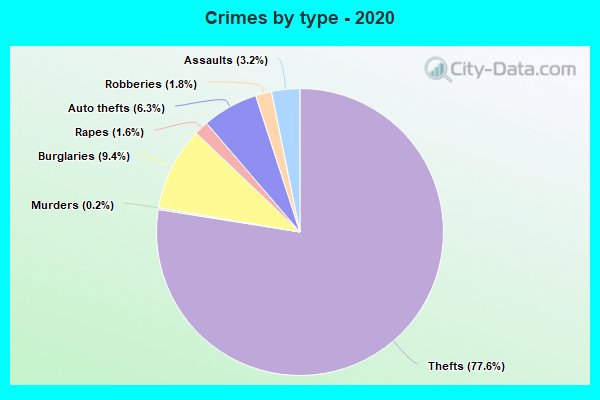
The 2022 crime rate in Pearland, TX is 107 (City-Data.com crime index), which is 2.3 times smaller than the U.S. average. It was higher than in 52.6% U.S. cities. The 2022 Pearland crime rate rose by 7% compared to 2021. The number of homicides stood at 1. In the last 5 years Pearland has seen decreasing violent crime and increasing property crime.See how dangerous Pearland, TX is compared to the nearest cities:
(Note: Higher means more crime)
(Note: Higher means more crime)
| Pearland: | 106.9 |
| Brookside Village: | 137.1 |
| Manvel: | 71.5 |
| Friendswood: | 72.3 |
| South Houston: | 385.1 |
| Iowa Colony: | 89.4 |
| Webster: | 549.9 |
| Arcola: | 224.3 |
| Pasadena: | 337.1 |
The City-Data.com crime index weighs serious crimes and violent crimes more heavily. Higher means more crime, U.S. average is 246.1. It adjusts for the number of visitors and daily workers commuting into cities.
- means the value is smaller than the state average.- means the value is about the same as the state average.
- means the value is bigger than the state average.
- means the value is much bigger than the state average.
According to our research of Texas and other state lists, there were 68 registered sex offenders living in Pearland, Texas as of May 22, 2024.
The ratio of all residents to sex offenders in Pearland is 1,635 to 1.
The ratio of registered sex offenders to all residents in this city is much lower than the state average.
Violent crime rate in 2022
| Pearland: | 53.2 |
| U.S. Average: | 219.8 |
Violent crime rate in 2021
| Pearland: | 60.2 |
| U.S. Average: | 224.8 |
Violent crime rate in 2020
| Pearland: | 67.0 |
| U.S. Average: | 228.2 |
Violent crime rate in 2019
| Pearland: | 57.4 |
| U.S. Average: | 219.9 |
Violent crime rate in 2018
| Pearland: | 60.0 |
| U.S. Average: | 221.2 |
Violent crime rate in 2017
| Pearland: | 81.9 |
| U.S. Average: | 226.2 |
Violent crime rate in 2016
| Pearland: | 106.8 |
| U.S. Average: | 227.3 |
Violent crime rate in 2015
| Pearland: | 105.8 |
| U.S. Average: | 219.3 |
Violent crime rate in 2014
| Pearland: | 101.4 |
| U.S. Average: | 211.1 |
Violent crime rate in 2013
| Pearland: | 98.3 |
| U.S. Average: | 214.2 |
Violent crime rate in 2012
| Pearland: | 76.0 |
| U.S. Average: | 187.4 |
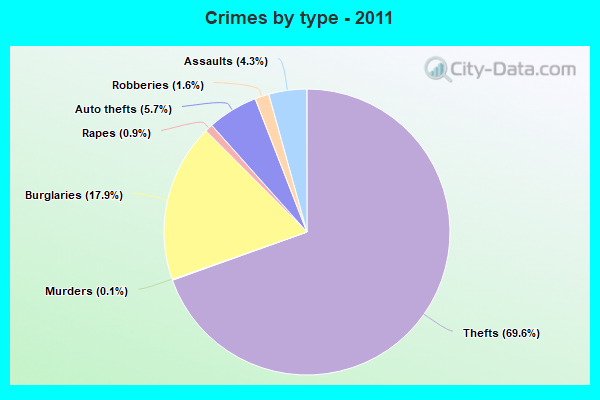
Violent crime rate in 2011
| Pearland: | 80.0 |
| U.S. Average: | 187.1 |
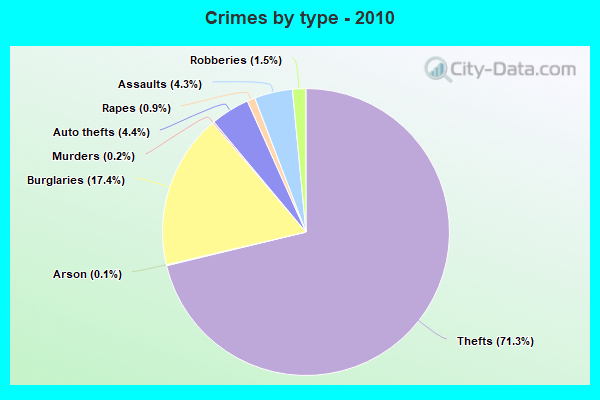
Violent crime rate in 2010
| Pearland: | 83.8 |
| U.S. Average: | 195.7 |
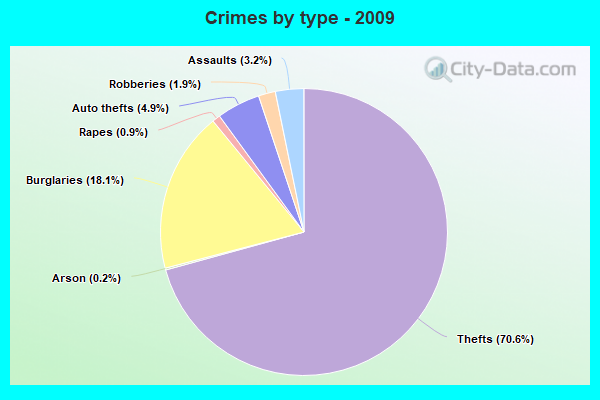
Violent crime rate in 2009
| Pearland: | 87.5 |
| U.S. Average: | 208.9 |
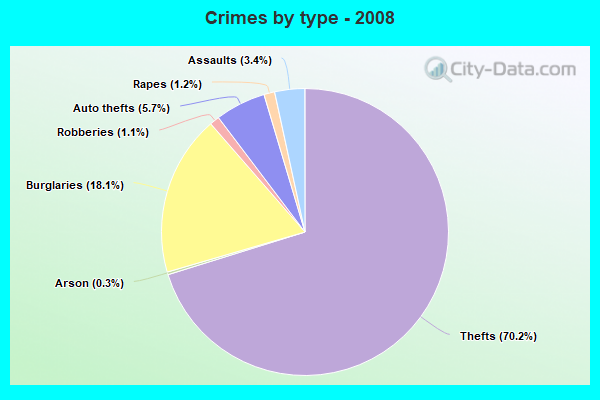
Violent crime rate in 2008
| Pearland: | 83.5 |
| U.S. Average: | 222.5 |
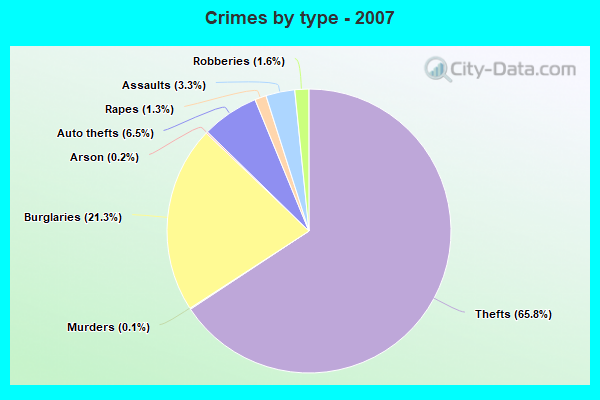
Violent crime rate in 2007
| Pearland: | 107.9 |
| U.S. Average: | 229.1 |
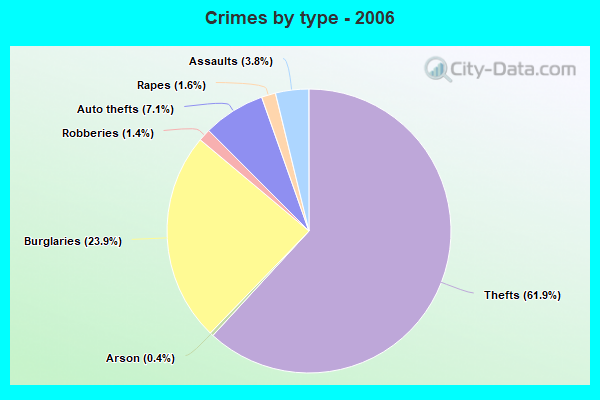
Violent crime rate in 2006
| Pearland: | 121.4 |
| U.S. Average: | 232.6 |
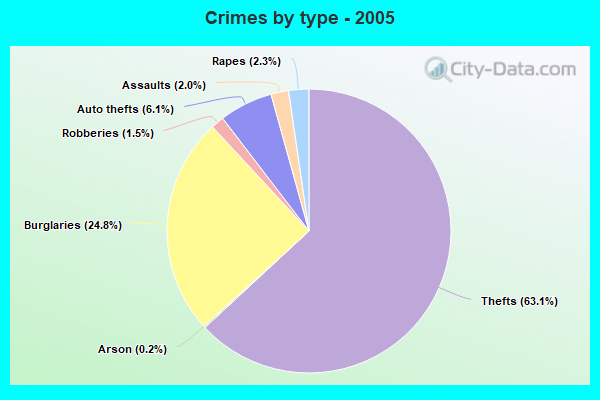
Violent crime rate in 2005
| Pearland: | 116.1 |
| U.S. Average: | 227.0 |
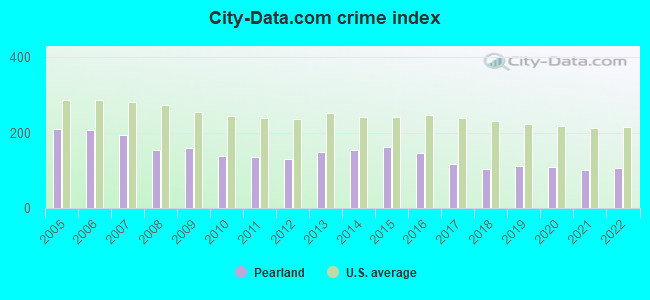
Property crime rate in 2022
| Pearland: | 118.2 |
| U.S. Average: | 166.5 |
Property crime rate in 2021
| Pearland: | 106.2 |
| U.S. Average: | 157.8 |
Property crime rate in 2020
| Pearland: | 102.8 |
| U.S. Average: | 169.6 |
Property crime rate in 2019
| Pearland: | 119.8 |
| U.S. Average: | 179.7 |
Property crime rate in 2018
| Pearland: | 107.7 |
| U.S. Average: | 190.2 |
Property crime rate in 2017
| Pearland: | 116.4 |
| U.S. Average: | 206.4 |
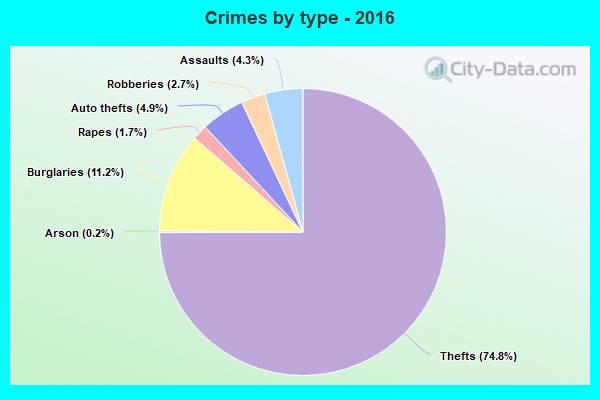
Property crime rate in 2016
| Pearland: | 134.8 |
| U.S. Average: | 216.6 |
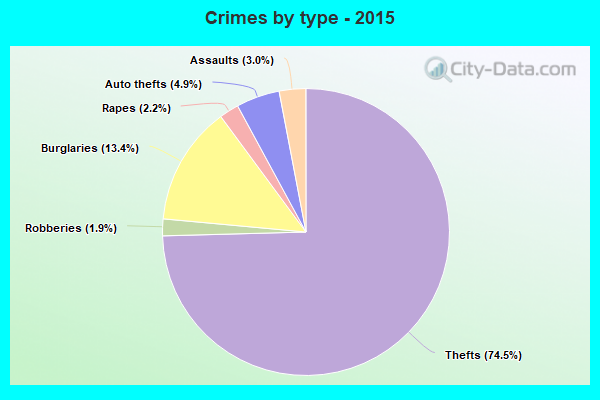
Property crime rate in 2015
| Pearland: | 157.1 |
| U.S. Average: | 221.5 |
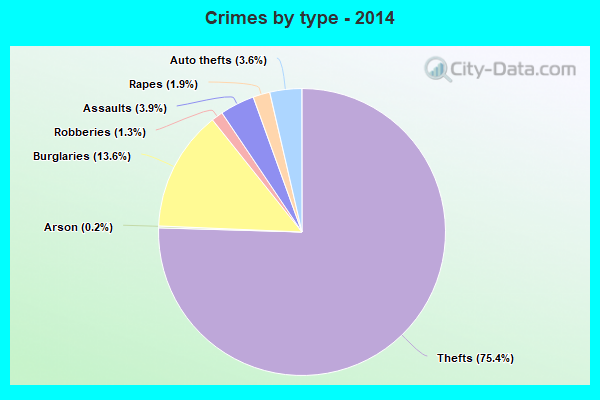
Property crime rate in 2014
| Pearland: | 153.1 |
| U.S. Average: | 230.8 |
Property crime rate in 2013
| Pearland: | 153.0 |
| U.S. Average: | 250.4 |
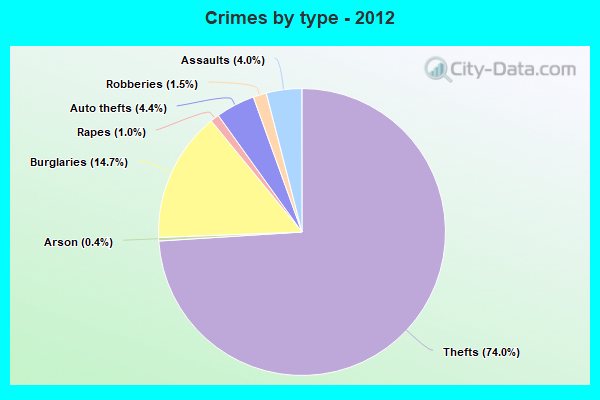
Property crime rate in 2012
| Pearland: | 145.5 |
| U.S. Average: | 267.3 |
Property crime rate in 2011
| Pearland: | 158.6 |
| U.S. Average: | 273.5 |
Property crime rate in 2010
| Pearland: | 158.7 |
| U.S. Average: | 276.4 |
Property crime rate in 2009
| Pearland: | 192.3 |
| U.S. Average: | 285.6 |
Property crime rate in 2008
| Pearland: | 186.9 |
| U.S. Average: | 302.2 |
Property crime rate in 2007
| Pearland: | 233.9 |
| U.S. Average: | 309.2 |
Property crime rate in 2006
| Pearland: | 259.1 |
| U.S. Average: | 317.3 |
Property crime rate in 2005
| Pearland: | 250.0 |
| U.S. Average: | 322.3 |

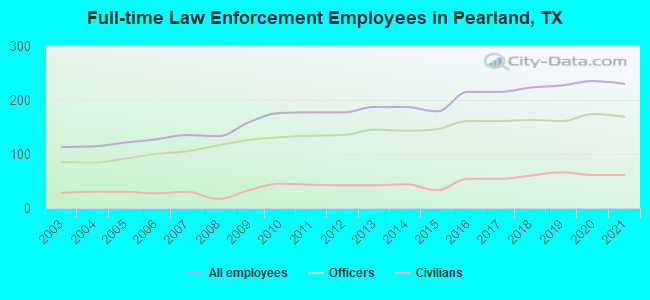
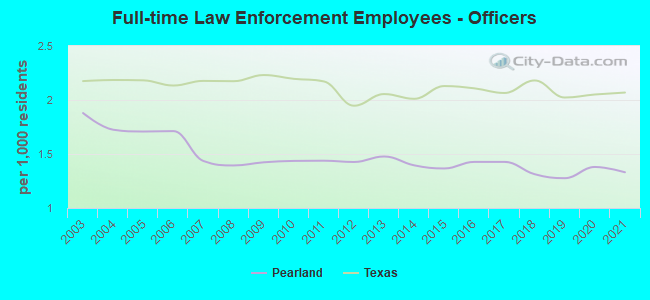
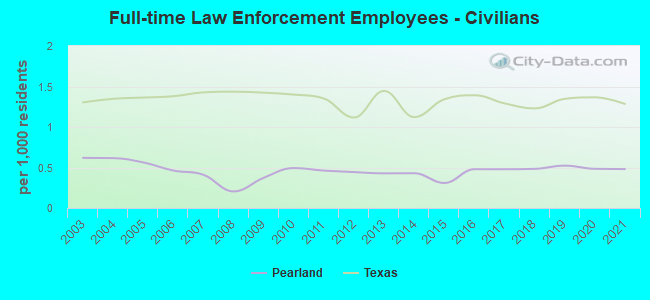
Full-time law enforcement employees in 2021, including police officers: 230 (169 officers - 157 male; 12 female).
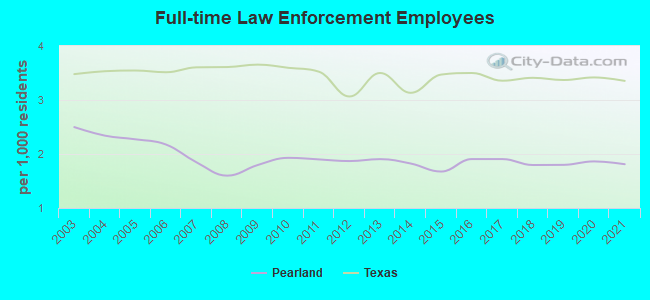
| Officers per 1,000 residents here: | 1.33 |
| Texas average: | 2.07 |
Full-time law enforcement employees in 2020, including police officers: 235 (174 officers - 164 male; 10 female).
| Officers per 1,000 residents here: | 1.38 |
| Texas average: | 2.05 |
Full-time law enforcement employees in 2019, including police officers: 227 (161 officers - 151 male; 10 female).
| Officers per 1,000 residents here: | 1.28 |
| Texas average: | 2.02 |
Full-time law enforcement employees in 2018, including police officers: 223 (163 officers - 153 male; 10 female).
| Officers per 1,000 residents here: | 1.31 |
| Texas average: | 2.18 |
Full-time law enforcement employees in 2016, including police officers: 215 (161 officers - 153 male; 8 female).
| Officers per 1,000 residents here: | 1.43 |
| Texas average: | 2.11 |
Full-time law enforcement employees in 2015, including police officers: 179 (146 officers - 140 male; 6 female).
| Officers per 1,000 residents here: | 1.37 |
| Texas average: | 2.13 |
Full-time law enforcement employees in 2014, including police officers: 187 (143 officers - 137 male; 6 female).
| Officers per 1,000 residents here: | 1.39 |
| Texas average: | 2.01 |
Full-time law enforcement employees in 2013, including police officers: 187 (145 officers - 139 male; 6 female).
| Officers per 1,000 residents here: | 1.48 |
| Texas average: | 2.05 |
Full-time law enforcement employees in 2012, including police officers: 177 (135 officers - 129 male; 6 female).
| Officers per 1,000 residents here: | 1.43 |
| Texas average: | 1.95 |
Full-time law enforcement employees in 2011, including police officers: 177 (134 officers - 128 male; 6 female).
| Officers per 1,000 residents here: | 1.44 |
| Texas average: | 2.17 |
Full-time law enforcement employees in 2010, including police officers: 176 (131 officers - 126 male; 5 female).
| Officers per 1,000 residents here: | 1.44 |
| Texas average: | 2.20 |
Full-time law enforcement employees in 2009, including police officers: 159 (126 officers - 120 male; 6 female).
| Officers per 1,000 residents here: | 1.42 |
| Texas average: | 2.23 |
Full-time law enforcement employees in 2008, including police officers: 133 (116 officers - 110 male; 6 female).
| Officers per 1,000 residents here: | 1.39 |
| Texas average: | 2.17 |
Full-time law enforcement employees in 2007, including police officers: 135 (105 officers - 100 male; 5 female).
| Officers per 1,000 residents here: | 1.43 |
| Texas average: | 2.18 |
Full-time law enforcement employees in 2006, including police officers: 127 (100 officers - 95 male; 5 female).
| Officers per 1,000 residents here: | 1.71 |
| Texas average: | 2.13 |
Full-time law enforcement employees in 2005, including police officers: 121 (91 officers - 87 male; 4 female).
| Officers per 1,000 residents here: | 1.71 |
| Texas average: | 2.18 |
Full-time law enforcement employees in 2004, including police officers: 114 (84 officers - 81 male; 3 female).
| Officers per 1,000 residents here: | 1.72 |
| Texas average: | 2.19 |
Full-time law enforcement employees in 2003, including police officers: 113 (85 officers - 82 male; 3 female).
| Officers per 1,000 residents here: | 1.88 |
| Texas average: | 2.17 |

Zip codes: 77584.