Crime rate in Pasadena, California (CA): murders, rapes, robberies, assaults, burglaries, thefts, auto thefts, arson, law enforcement employees, police officers, crime map
Crime rate in Pasadena, CA
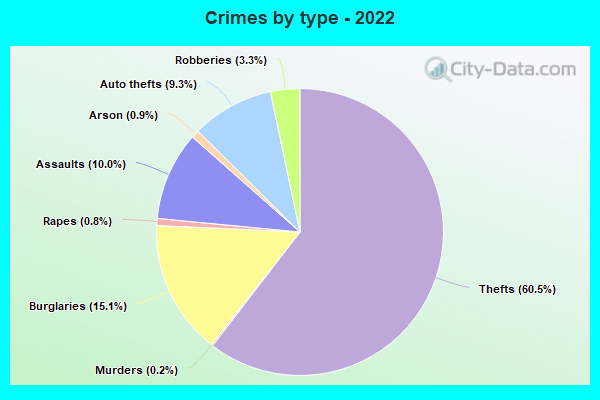
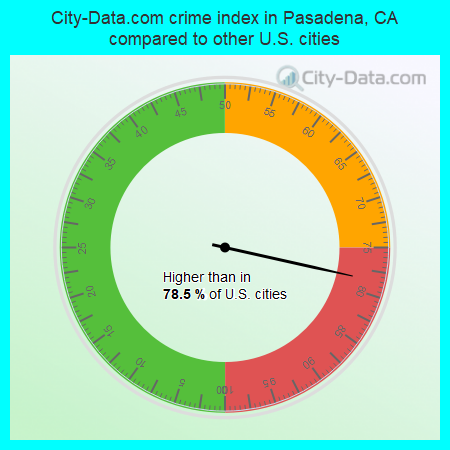
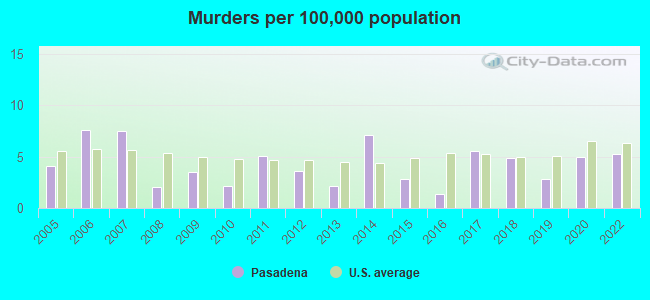
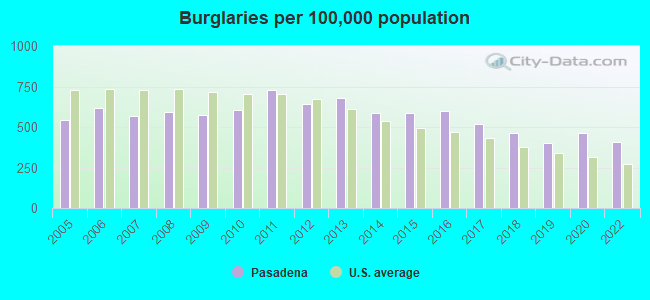
The 2022 crime rate in Pasadena, CA is 221 (City-Data.com crime index), which is about the average for the U.S. cities. It was higher than in 78.5% U.S. cities. The 2022 Pasadena crime rate rose by 7% compared to 2020. The number of homicides stood at 7. In the last 5 years Pasadena has seen decreasing violent crime and increasing property crime.See how dangerous Pasadena, CA is compared to the nearest cities:
(Note: Higher means more crime)
(Note: Higher means more crime)
| Pasadena: | 221.2 |
| San Marino: | 97.1 |
| South Pasadena: | 147.3 |
| Sierra Madre: | 68.8 |
| San Gabriel: | 121.9 |
| Alhambra: | 187.4 |
| La Canada Flintridge: | 123.5 |
| Temple City: | 140.2 |
| Arcadia: | 231.7 |
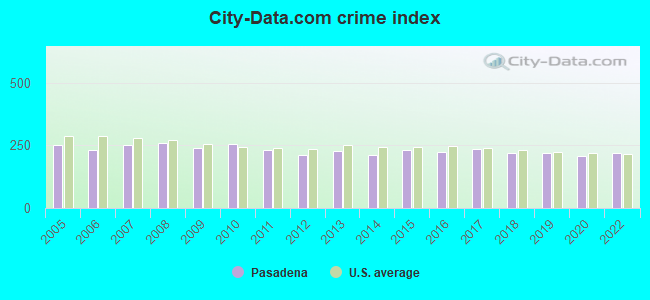
The City-Data.com crime index weighs serious crimes and violent crimes more heavily. Higher means more crime, U.S. average is 246.1. It adjusts for the number of visitors and daily workers commuting into cities.
- means the value is smaller than the state average.- means the value is about the same as the state average.
- means the value is bigger than the state average.
- means the value is much bigger than the state average.
According to our research of California and other state lists, there were 104 registered sex offenders living in Pasadena, California as of April 27, 2024.
The ratio of all residents to sex offenders in Pasadena is 1,366 to 1.
The ratio of registered sex offenders to all residents in this city is lower than the state average.
Violent crime rate in 2022
| Pasadena: | 210.0 |
| U.S. Average: | 219.8 |
Violent crime rate in 2020
| Pasadena: | 171.8 |
| U.S. Average: | 228.2 |
Violent crime rate in 2019
| Pasadena: | 236.4 |
| U.S. Average: | 219.9 |
Violent crime rate in 2018
| Pasadena: | 214.4 |
| U.S. Average: | 221.2 |
Violent crime rate in 2017
| Pasadena: | 227.1 |
| U.S. Average: | 226.2 |
Violent crime rate in 2016
| Pasadena: | 184.6 |
| U.S. Average: | 227.3 |
Violent crime rate in 2015
| Pasadena: | 175.2 |
| U.S. Average: | 219.3 |
Violent crime rate in 2014
| Pasadena: | 159.2 |
| U.S. Average: | 211.1 |
Violent crime rate in 2013
| Pasadena: | 168.3 |
| U.S. Average: | 214.2 |
Violent crime rate in 2012
| Pasadena: | 168.2 |
| U.S. Average: | 187.4 |
Violent crime rate in 2011
| Pasadena: | 173.7 |
| U.S. Average: | 187.1 |
Violent crime rate in 2010
| Pasadena: | 212.9 |
| U.S. Average: | 195.7 |
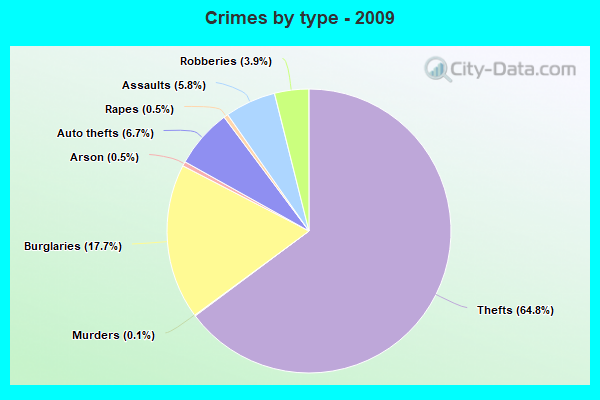
Violent crime rate in 2009
| Pasadena: | 181.5 |
| U.S. Average: | 208.9 |
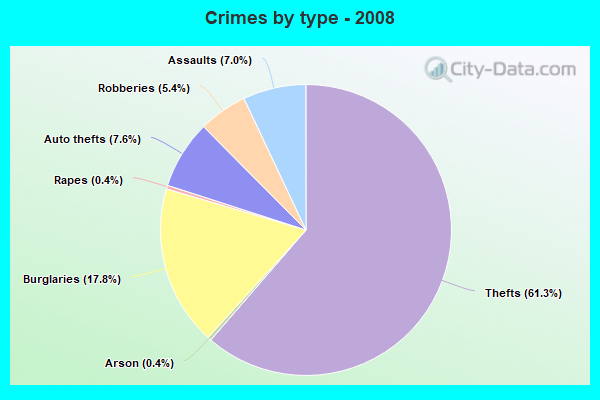
Violent crime rate in 2008
| Pasadena: | 225.2 |
| U.S. Average: | 222.5 |
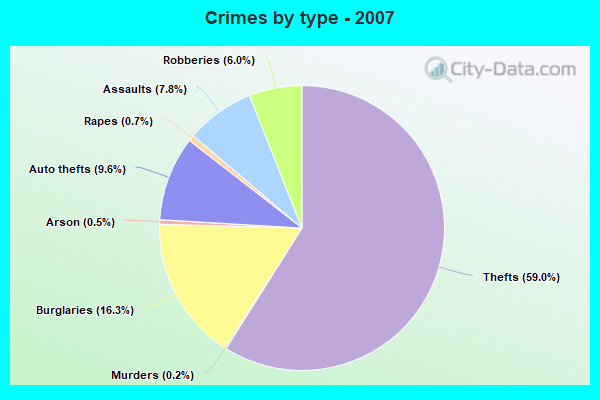
Violent crime rate in 2007
| Pasadena: | 232.8 |
| U.S. Average: | 229.1 |
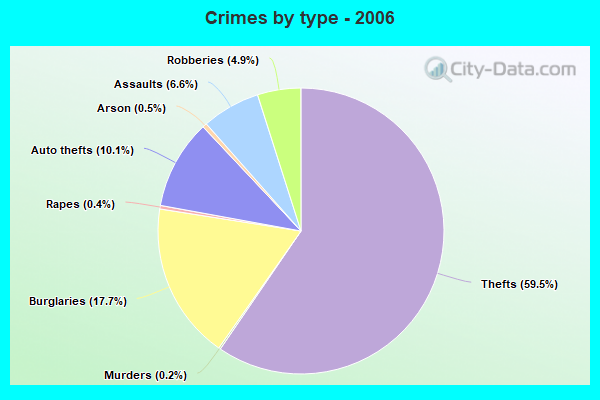
Violent crime rate in 2006
| Pasadena: | 191.3 |
| U.S. Average: | 232.6 |
Violent crime rate in 2005
| Pasadena: | 243.5 |
| U.S. Average: | 227.0 |
Property crime rate in 2022
| Pasadena: | 200.5 |
| U.S. Average: | 166.5 |
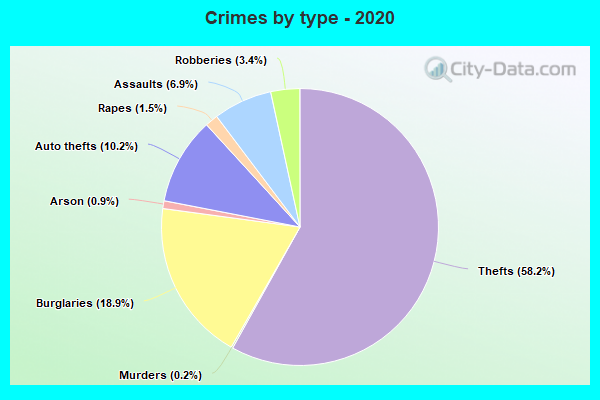
Property crime rate in 2020
| Pasadena: | 201.0 |
| U.S. Average: | 169.6 |
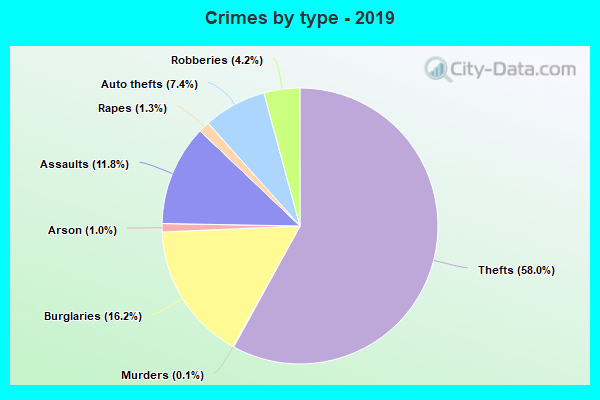
Property crime rate in 2019
| Pasadena: | 179.5 |
| U.S. Average: | 179.7 |
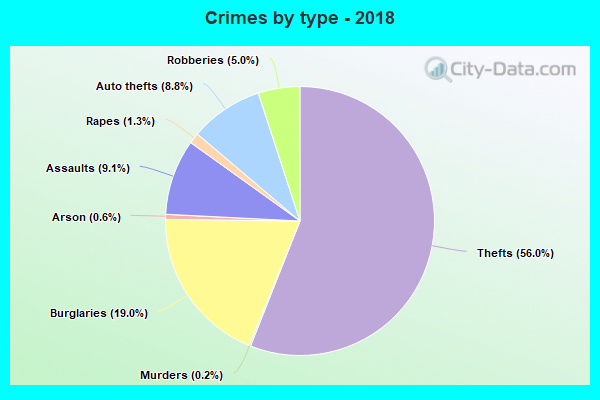
Property crime rate in 2018
| Pasadena: | 192.7 |
| U.S. Average: | 190.2 |
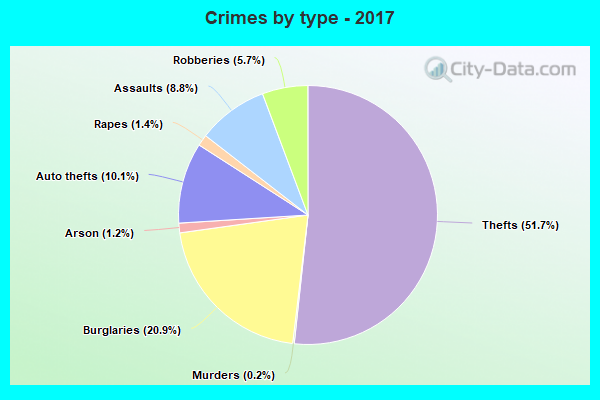
Property crime rate in 2017
| Pasadena: | 206.4 |
| U.S. Average: | 206.4 |
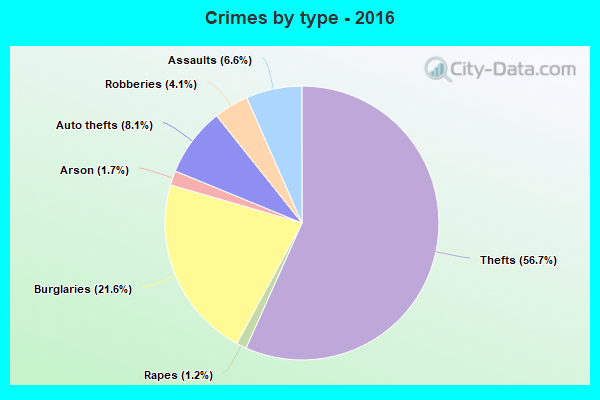
Property crime rate in 2016
| Pasadena: | 233.0 |
| U.S. Average: | 216.6 |
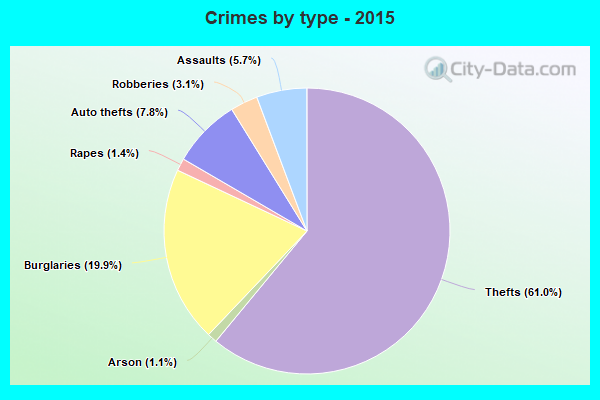
Property crime rate in 2015
| Pasadena: | 240.8 |
| U.S. Average: | 221.5 |
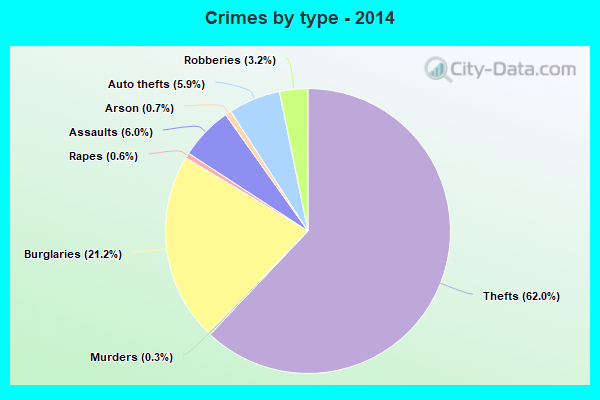
Property crime rate in 2014
| Pasadena: | 228.2 |
| U.S. Average: | 230.8 |
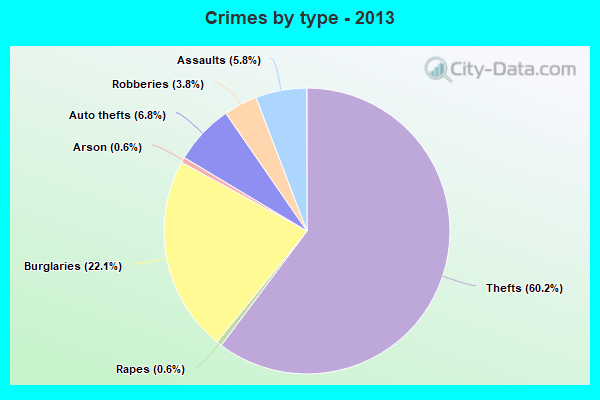
Property crime rate in 2013
| Pasadena: | 257.9 |
| U.S. Average: | 250.4 |
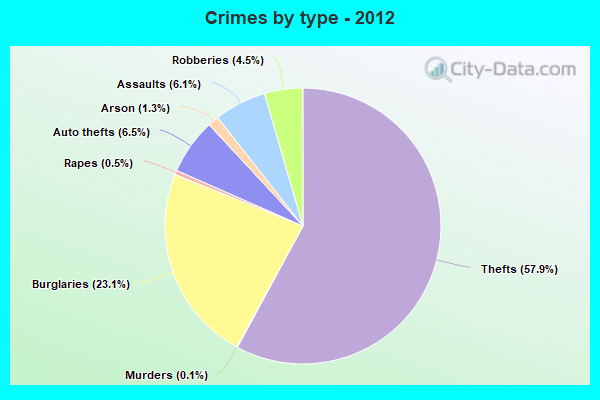
Property crime rate in 2012
| Pasadena: | 235.0 |
| U.S. Average: | 267.3 |
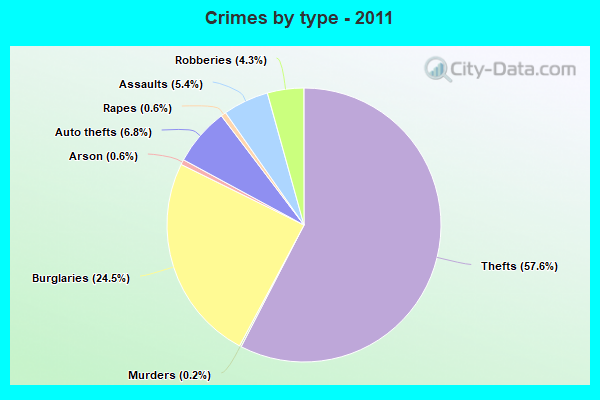
Property crime rate in 2011
| Pasadena: | 261.8 |
| U.S. Average: | 273.5 |
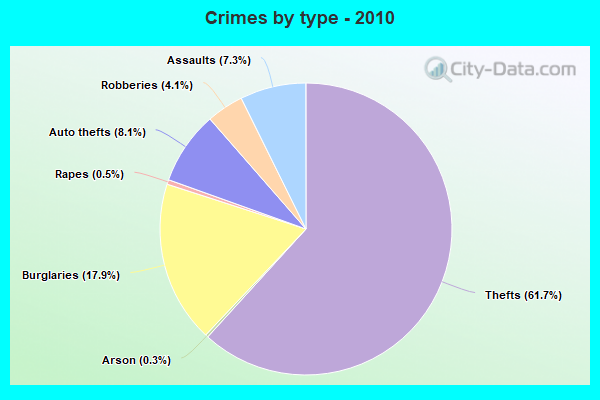
Property crime rate in 2010
| Pasadena: | 267.1 |
| U.S. Average: | 276.4 |
Property crime rate in 2009
| Pasadena: | 251.7 |
| U.S. Average: | 285.6 |
Property crime rate in 2008
| Pasadena: | 259.1 |
| U.S. Average: | 302.2 |
Property crime rate in 2007
| Pasadena: | 222.8 |
| U.S. Average: | 309.2 |
Property crime rate in 2006
| Pasadena: | 233.4 |
| U.S. Average: | 317.3 |
Property crime rate in 2005
| Pasadena: | 227.1 |
| U.S. Average: | 322.3 |
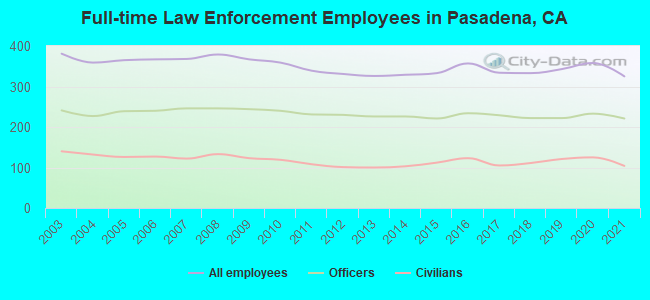
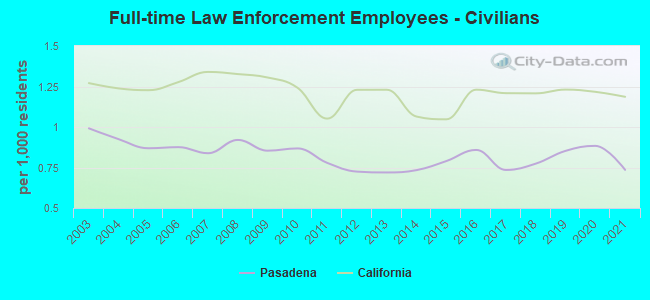
Full-time law enforcement employees in 2021, including police officers: 325 (221 officers - 188 male; 33 female).
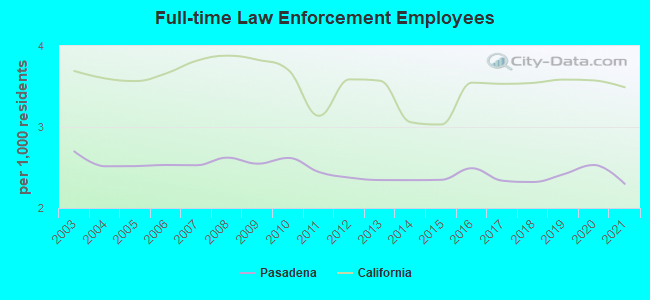
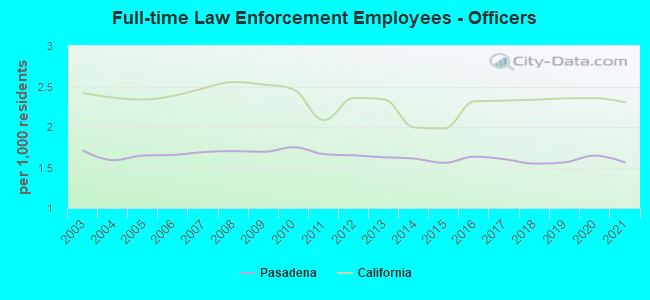
| Officers per 1,000 residents here: | 1.56 |
| California average: | 2.30 |
Full-time law enforcement employees in 2020, including police officers: 358 (233 officers - 201 male; 32 female).
| Officers per 1,000 residents here: | 1.65 |
| California average: | 2.36 |
Full-time law enforcement employees in 2019, including police officers: 343 (222 officers - 193 male; 29 female).
| Officers per 1,000 residents here: | 1.56 |
| California average: | 2.35 |
Full-time law enforcement employees in 2018, including police officers: 333 (222 officers - 195 male; 27 female).
| Officers per 1,000 residents here: | 1.55 |
| California average: | 2.34 |
Full-time law enforcement employees in 2017, including police officers: 334 (229 officers - 202 male; 27 female).
| Officers per 1,000 residents here: | 1.60 |
| California average: | 2.32 |
Full-time law enforcement employees in 2016, including police officers: 357 (234 officers - 203 male; 31 female).
| Officers per 1,000 residents here: | 1.63 |
| California average: | 2.32 |
Full-time law enforcement employees in 2015, including police officers: 333 (221 officers - 190 male; 31 female).
| Officers per 1,000 residents here: | 1.56 |
| California average: | 1.98 |
Full-time law enforcement employees in 2014, including police officers: 329 (226 officers - 192 male; 34 female).
| Officers per 1,000 residents here: | 1.61 |
| California average: | 2.00 |
Full-time law enforcement employees in 2013, including police officers: 326 (226 officers - 191 male; 35 female).
| Officers per 1,000 residents here: | 1.63 |
| California average: | 2.34 |
Full-time law enforcement employees in 2012, including police officers: 331 (230 officers - 195 male; 35 female).
| Officers per 1,000 residents here: | 1.65 |
| California average: | 2.36 |
Full-time law enforcement employees in 2011, including police officers: 339 (231 officers - 196 male; 35 female).
| Officers per 1,000 residents here: | 1.67 |
| California average: | 2.09 |
Full-time law enforcement employees in 2010, including police officers: 359 (240 officers - 203 male; 37 female).
| Officers per 1,000 residents here: | 1.75 |
| California average: | 2.46 |
Full-time law enforcement employees in 2009, including police officers: 367 (244 officers - 210 male; 34 female).
| Officers per 1,000 residents here: | 1.69 |
| California average: | 2.52 |
Full-time law enforcement employees in 2008, including police officers: 379 (246 officers - 211 male; 35 female).
| Officers per 1,000 residents here: | 1.70 |
| California average: | 2.55 |
Full-time law enforcement employees in 2007, including police officers: 368 (246 officers - 209 male; 37 female).
| Officers per 1,000 residents here: | 1.69 |
| California average: | 2.48 |
Full-time law enforcement employees in 2006, including police officers: 367 (240 officers - 204 male; 36 female).
| Officers per 1,000 residents here: | 1.65 |
| California average: | 2.38 |
Full-time law enforcement employees in 2005, including police officers: 365 (239 officers - 202 male; 37 female).
| Officers per 1,000 residents here: | 1.65 |
| California average: | 2.34 |
Full-time law enforcement employees in 2004, including police officers: 359 (227 officers - 191 male; 36 female).
| Officers per 1,000 residents here: | 1.59 |
| California average: | 2.36 |
Full-time law enforcement employees in 2003, including police officers: 381 (241 officers - 207 male; 34 female).
| Officers per 1,000 residents here: | 1.71 |
| California average: | 2.42 |