Crime rate in Norman, Oklahoma (OK): murders, rapes, robberies, assaults, burglaries, thefts, auto thefts, arson, law enforcement employees, police officers, crime map
Crime rate in Norman, OK
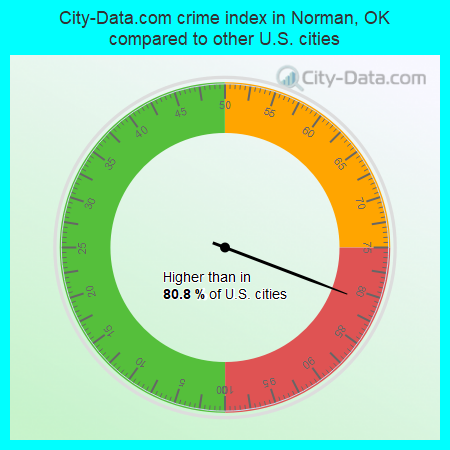
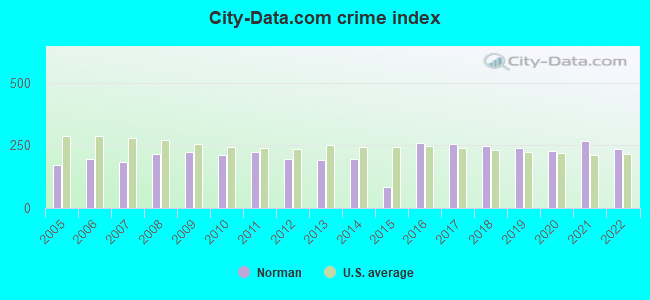
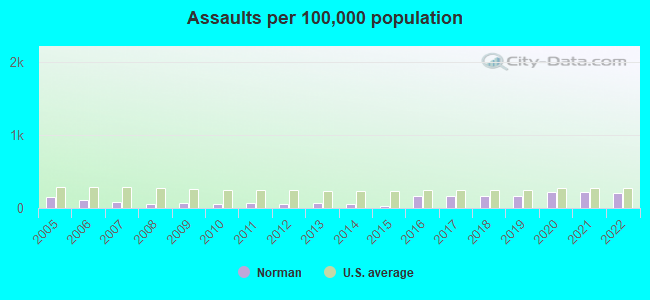
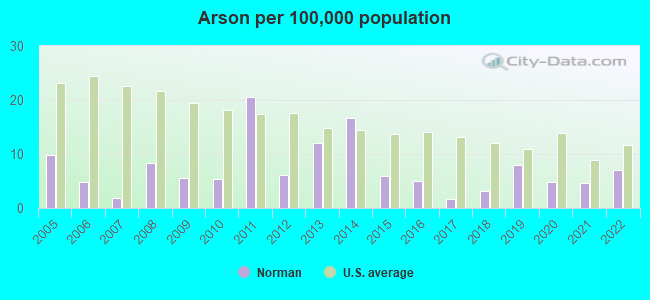
The 2022 crime rate in Norman, OK is 235 (City-Data.com crime index), which is comparable to the U.S. average. It was higher than in 80.8% U.S. cities. The 2022 Norman crime rate fell by 12% compared to 2021. The number of homicides stood at 2. In the last 5 years Norman has seen rise of violent crime and decline of property crime.See how dangerous Norman, OK is compared to the nearest cities:
(Note: Higher means more crime)
(Note: Higher means more crime)
| Norman: | 234.7 |
| Noble: | 111.3 |
| Moore: | 171.8 |
| Newcastle: | 106.0 |
| Washington: | 15.8 |
| Valley Brook: | 476.9 |
| Blanchard: | 49.6 |
| Purcell: | 290.7 |
| Lexington: | 251.9 |
The City-Data.com crime index weighs serious crimes and violent crimes more heavily. Higher means more crime, U.S. average is 246.1. It adjusts for the number of visitors and daily workers commuting into cities.
- means the value is smaller than the state average.- means the value is about the same as the state average.
- means the value is bigger than the state average.
- means the value is much bigger than the state average.
According to our research of Oklahoma and other state lists, there were 94 registered sex offenders living in Norman, Oklahoma as of May 17, 2024.
The ratio of all residents to sex offenders in Norman is 1,300 to 1.
The ratio of registered sex offenders to all residents in this city is much lower than the state average.
Violent crime rate in 2022
| Norman: | 184.3 |
| U.S. Average: | 219.8 |
Violent crime rate in 2021
| Norman: | 205.0 |
| U.S. Average: | 224.8 |
Violent crime rate in 2020
| Norman: | 176.3 |
| U.S. Average: | 228.2 |
Violent crime rate in 2019
| Norman: | 179.5 |
| U.S. Average: | 219.9 |
Violent crime rate in 2018
| Norman: | 179.8 |
| U.S. Average: | 221.2 |
Violent crime rate in 2017
| Norman: | 198.7 |
| U.S. Average: | 226.2 |
Violent crime rate in 2016
| Norman: | 169.9 |
| U.S. Average: | 227.3 |
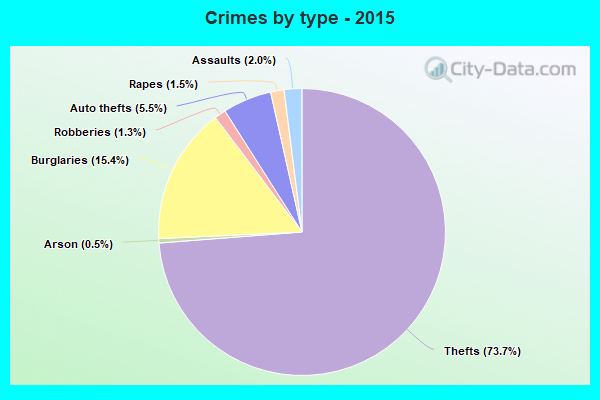
Violent crime rate in 2015
| Norman: | 41.3 |
| U.S. Average: | 219.3 |
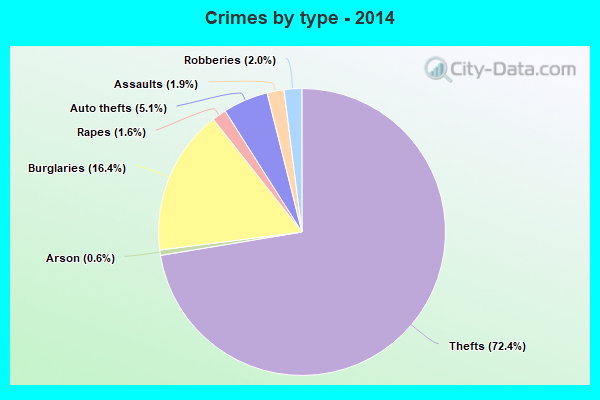
Violent crime rate in 2014
| Norman: | 106.3 |
| U.S. Average: | 211.1 |
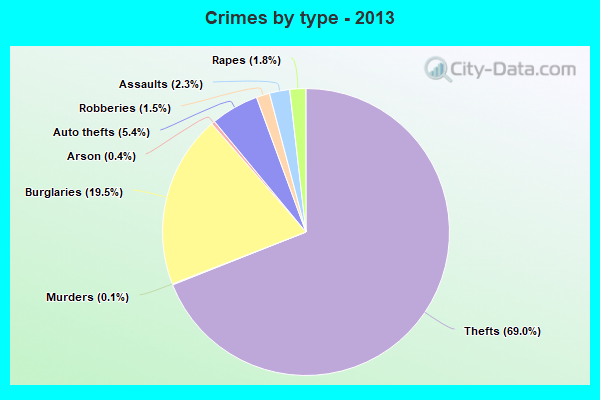
Violent crime rate in 2013
| Norman: | 105.2 |
| U.S. Average: | 214.2 |
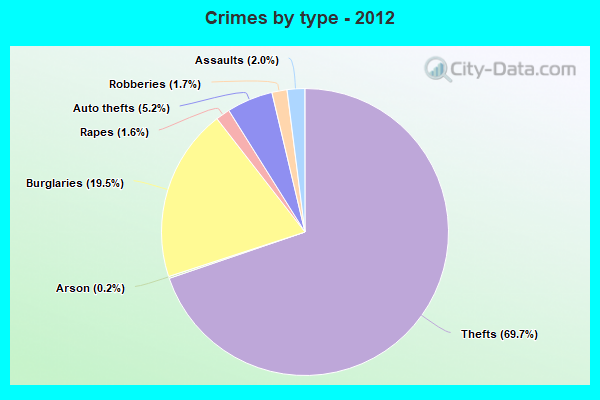
Violent crime rate in 2012
| Norman: | 100.0 |
| U.S. Average: | 187.4 |
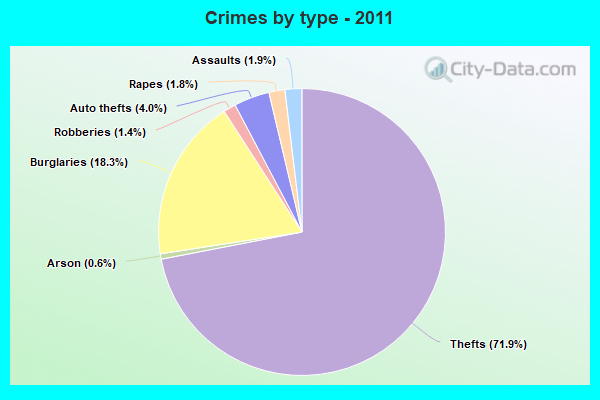
Violent crime rate in 2011
| Norman: | 117.7 |
| U.S. Average: | 187.1 |
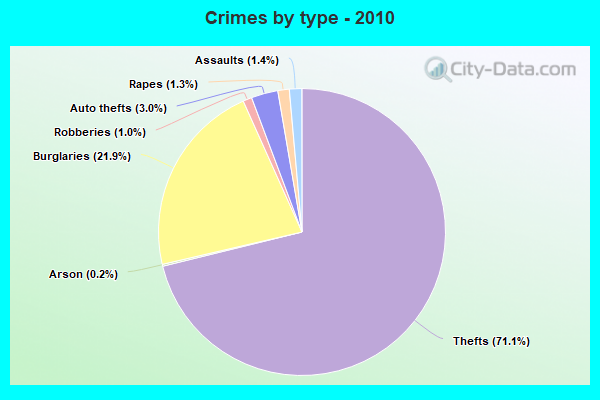
Violent crime rate in 2010
| Norman: | 86.1 |
| U.S. Average: | 195.7 |
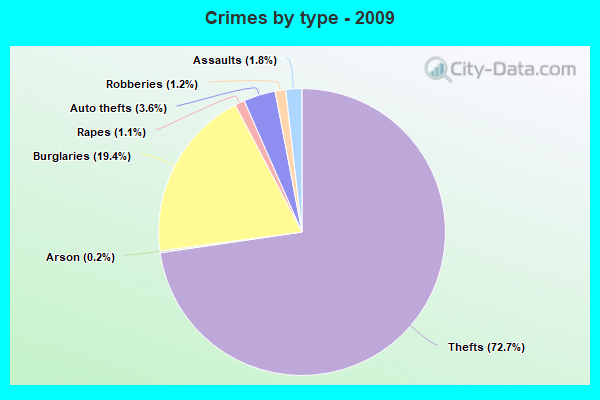
Violent crime rate in 2009
| Norman: | 95.2 |
| U.S. Average: | 208.9 |
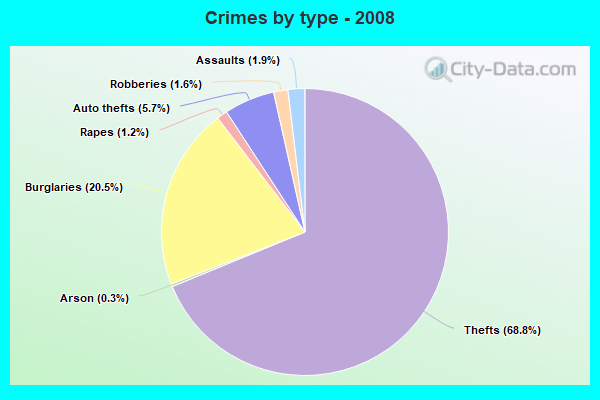
Violent crime rate in 2008
| Norman: | 100.4 |
| U.S. Average: | 222.5 |
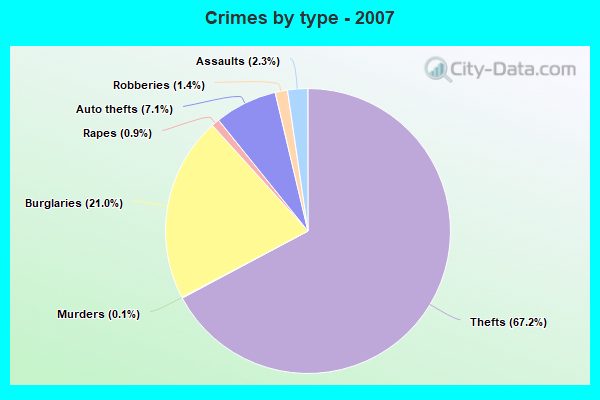
Violent crime rate in 2007
| Norman: | 83.2 |
| U.S. Average: | 229.1 |
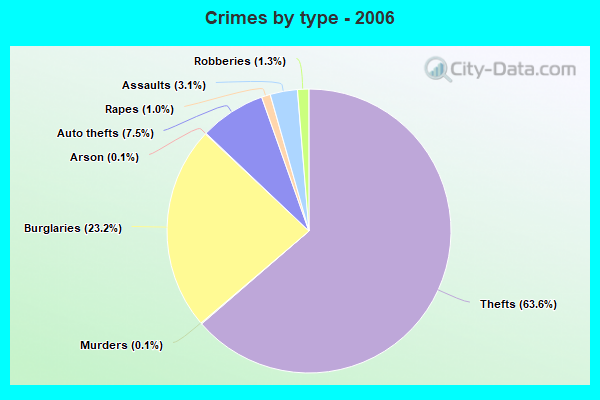
Violent crime rate in 2006
| Norman: | 99.1 |
| U.S. Average: | 232.6 |
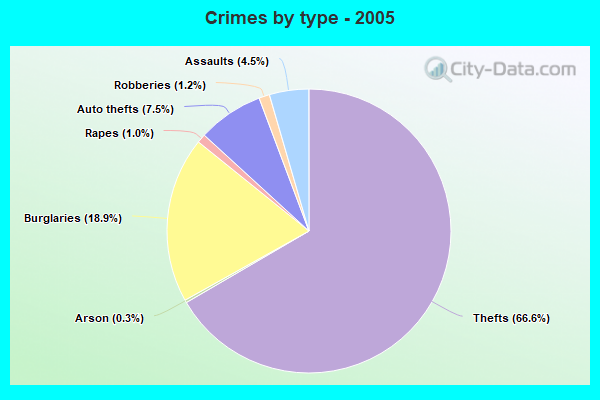
Violent crime rate in 2005
| Norman: | 99.7 |
| U.S. Average: | 227.0 |
Property crime rate in 2022
| Norman: | 218.7 |
| U.S. Average: | 166.5 |
Property crime rate in 2021
| Norman: | 250.1 |
| U.S. Average: | 157.8 |
Property crime rate in 2020
| Norman: | 222.8 |
| U.S. Average: | 169.6 |
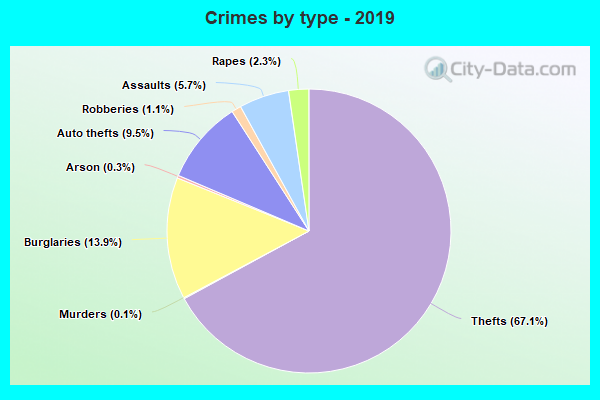
Property crime rate in 2019
| Norman: | 227.4 |
| U.S. Average: | 179.7 |
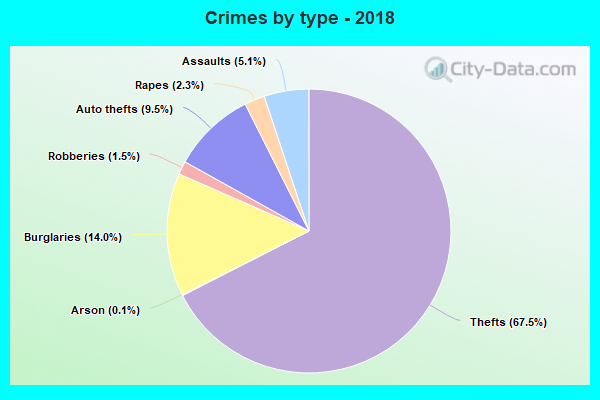
Property crime rate in 2018
| Norman: | 237.7 |
| U.S. Average: | 190.2 |
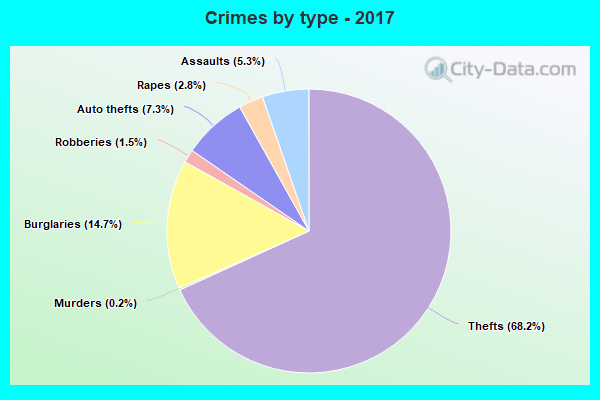
Property crime rate in 2017
| Norman: | 227.1 |
| U.S. Average: | 206.4 |
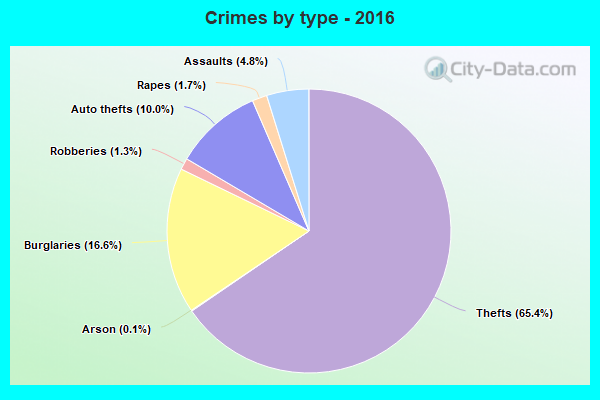
Property crime rate in 2016
| Norman: | 287.4 |
| U.S. Average: | 216.6 |
Property crime rate in 2015
| Norman: | 96.2 |
| U.S. Average: | 221.5 |
Property crime rate in 2014
| Norman: | 220.6 |
| U.S. Average: | 230.8 |
Property crime rate in 2013
| Norman: | 218.6 |
| U.S. Average: | 250.4 |
Property crime rate in 2012
| Norman: | 231.4 |
| U.S. Average: | 267.3 |
Property crime rate in 2011
| Norman: | 258.9 |
| U.S. Average: | 273.5 |
Property crime rate in 2010
| Norman: | 279.8 |
| U.S. Average: | 276.4 |
Property crime rate in 2009
| Norman: | 294.3 |
| U.S. Average: | 285.6 |
Property crime rate in 2008
| Norman: | 275.1 |
| U.S. Average: | 302.2 |
Property crime rate in 2007
| Norman: | 243.0 |
| U.S. Average: | 309.2 |
Property crime rate in 2006
| Norman: | 255.2 |
| U.S. Average: | 317.3 |
Property crime rate in 2005
| Norman: | 215.9 |
| U.S. Average: | 322.3 |

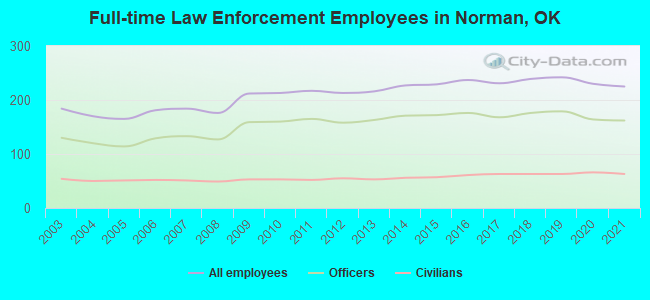
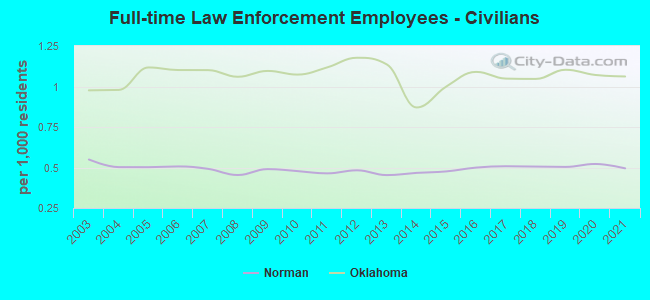
Full-time law enforcement employees in 2021, including police officers: 225 (162 officers - 150 male; 12 female).
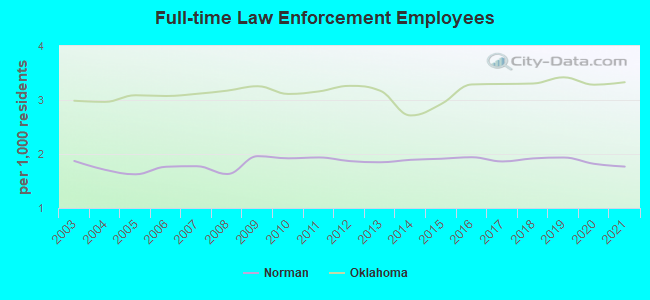
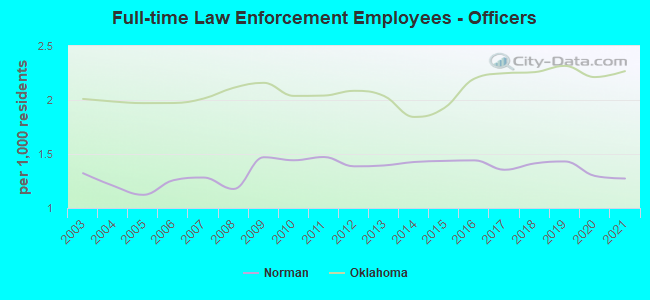
| Officers per 1,000 residents here: | 1.27 |
| Oklahoma average: | 2.27 |
Full-time law enforcement employees in 2020, including police officers: 230 (164 officers - 152 male; 12 female).
| Officers per 1,000 residents here: | 1.30 |
| Oklahoma average: | 2.21 |
Full-time law enforcement employees in 2019, including police officers: 242 (179 officers - 165 male; 14 female).
| Officers per 1,000 residents here: | 1.43 |
| Oklahoma average: | 2.32 |
Full-time law enforcement employees in 2018, including police officers: 239 (176 officers - 163 male; 13 female).
| Officers per 1,000 residents here: | 1.41 |
| Oklahoma average: | 2.26 |
Full-time law enforcement employees in 2017, including police officers: 231 (168 officers - 156 male; 12 female).
| Officers per 1,000 residents here: | 1.35 |
| Oklahoma average: | 2.25 |
Full-time law enforcement employees in 2016, including police officers: 237 (176 officers - 161 male; 15 female).
| Officers per 1,000 residents here: | 1.44 |
| Oklahoma average: | 2.20 |
Full-time law enforcement employees in 2015, including police officers: 229 (172 officers - 160 male; 12 female).
| Officers per 1,000 residents here: | 1.44 |
| Oklahoma average: | 1.93 |
Full-time law enforcement employees in 2014, including police officers: 227 (171 officers - 158 male; 13 female).
| Officers per 1,000 residents here: | 1.43 |
| Oklahoma average: | 1.84 |
Full-time law enforcement employees in 2013, including police officers: 216 (163 officers - 150 male; 13 female).
| Officers per 1,000 residents here: | 1.39 |
| Oklahoma average: | 2.04 |
Full-time law enforcement employees in 2012, including police officers: 213 (158 officers - 146 male; 12 female).
| Officers per 1,000 residents here: | 1.39 |
| Oklahoma average: | 2.08 |
Full-time law enforcement employees in 2011, including police officers: 217 (165 officers - 151 male; 14 female).
| Officers per 1,000 residents here: | 1.47 |
| Oklahoma average: | 2.04 |
Full-time law enforcement employees in 2010, including police officers: 213 (160 officers - 146 male; 14 female).
| Officers per 1,000 residents here: | 1.44 |
| Oklahoma average: | 2.04 |
Full-time law enforcement employees in 2009, including police officers: 212 (159 officers - 146 male; 13 female).
| Officers per 1,000 residents here: | 1.47 |
| Oklahoma average: | 2.16 |
Full-time law enforcement employees in 2008, including police officers: 176 (127 officers - 119 male; 8 female).
| Officers per 1,000 residents here: | 1.18 |
| Oklahoma average: | 2.11 |
Full-time law enforcement employees in 2007, including police officers: 184 (133 officers - 123 male; 10 female).
| Officers per 1,000 residents here: | 1.28 |
| Oklahoma average: | 2.01 |
Full-time law enforcement employees in 2006, including police officers: 181 (129 officers - 117 male; 12 female).
| Officers per 1,000 residents here: | 1.26 |
| Oklahoma average: | 1.97 |
Full-time law enforcement employees in 2005, including police officers: 165 (114 officers - 105 male; 9 female).
| Officers per 1,000 residents here: | 1.12 |
| Oklahoma average: | 1.97 |
Full-time law enforcement employees in 2004, including police officers: 170 (120 officers - 110 male; 10 female).
| Officers per 1,000 residents here: | 1.21 |
| Oklahoma average: | 1.99 |
Full-time law enforcement employees in 2003, including police officers: 184 (130 officers - 120 male; 10 female).
| Officers per 1,000 residents here: | 1.32 |
| Oklahoma average: | 2.01 |
Zip codes: 73019, 73026.