Crime rate in Myrtle Beach, South Carolina (SC): murders, rapes, robberies, assaults, burglaries, thefts, auto thefts, arson, law enforcement employees, police officers, crime map
Crime rate in Myrtle Beach, SC
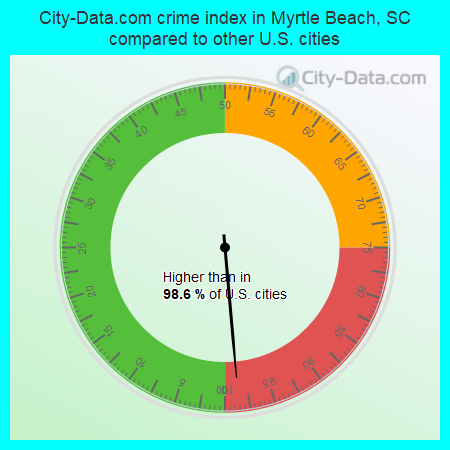
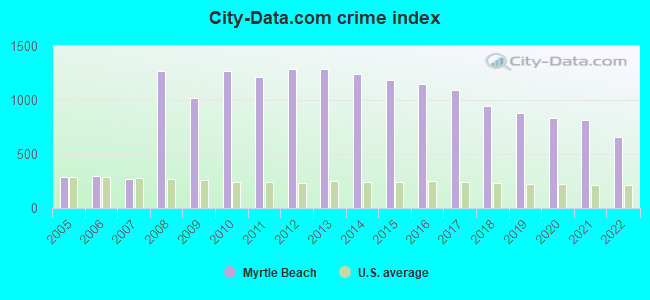
The 2022 crime rate in Myrtle Beach, SC is 661 (City-Data.com crime index), which is 2.7 times greater than the U.S. average. It was higher than in 98.6% U.S. cities. The 2022 Myrtle Beach crime rate fell by 19% compared to 2021. The number of homicides stood at 6 - a decrease of 3 compared to 2021. In the last 5 years Myrtle Beach has seen decreasing violent crime and decline of property crime.See how dangerous Myrtle Beach, SC is compared to the nearest cities:
(Note: Higher means more crime)
(Note: Higher means more crime)
| Myrtle Beach: | 660.7 |
| Surfside Beach: | 242.7 |
| Briarcliffe Acres: | 7.9 |
| Atlantic Beach: | 223.0 |
| North Myrtle Beach: | 343.2 |
| Conway: | 330.8 |
| Pawleys Island: | 142.9 |
| Loris: | 210.4 |
| Sunset Beach: | 37.9 |
Type |
2009 |
2010 |
2011 |
2012 |
2013 |
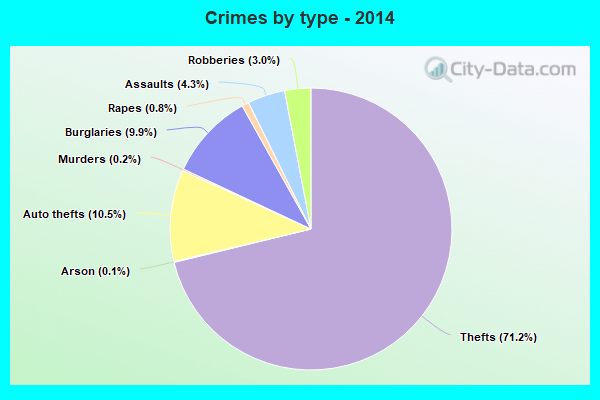
2014 |
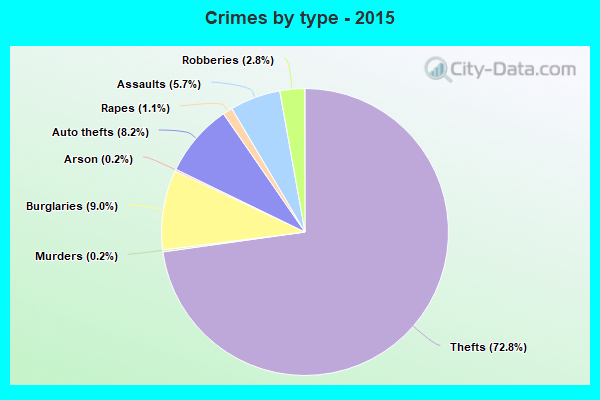
2015 |
2016 |
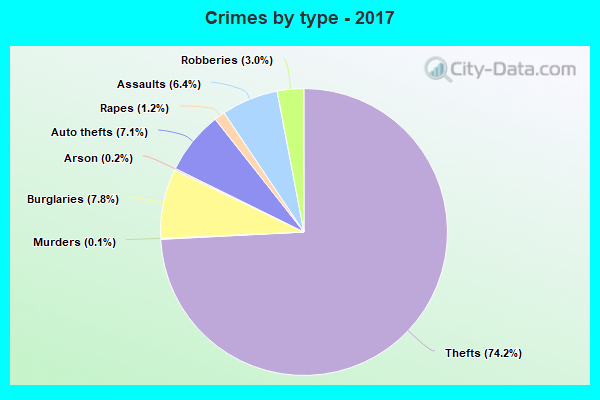
2017 |
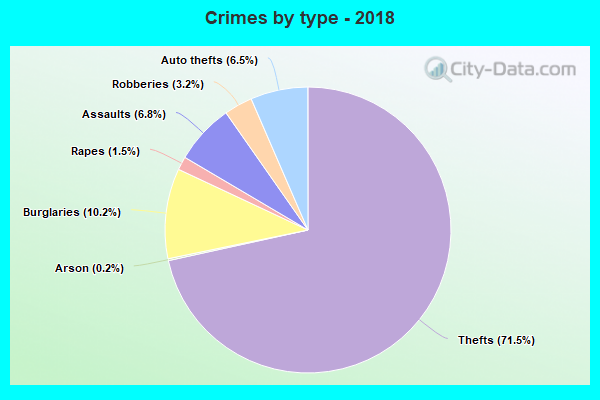
2018 |
2019 |
2020 |
2021 |
2022 |
|---|---|---|---|---|---|---|---|---|---|---|---|---|---|---|
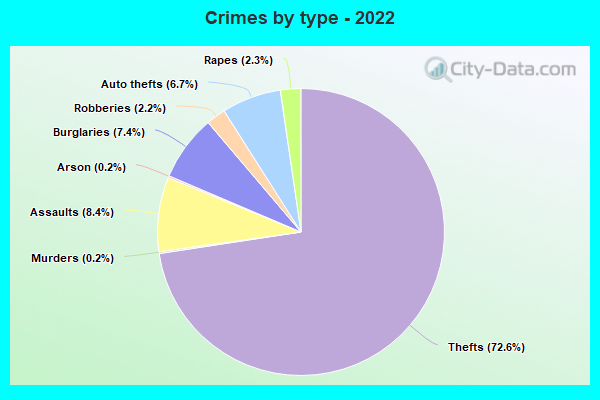
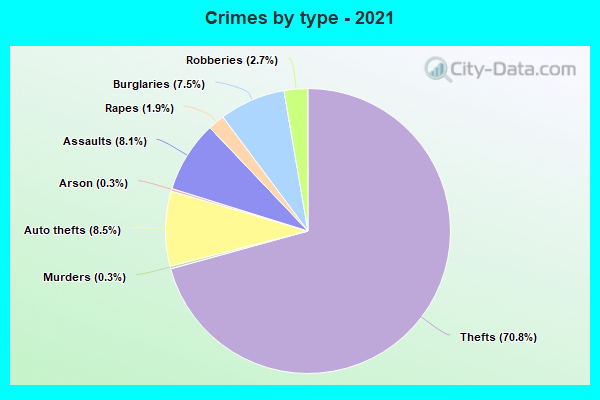
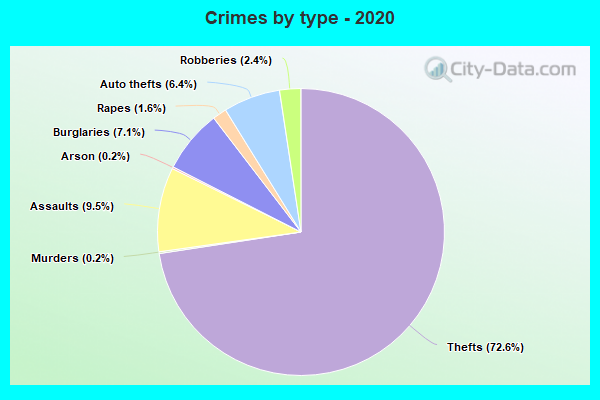
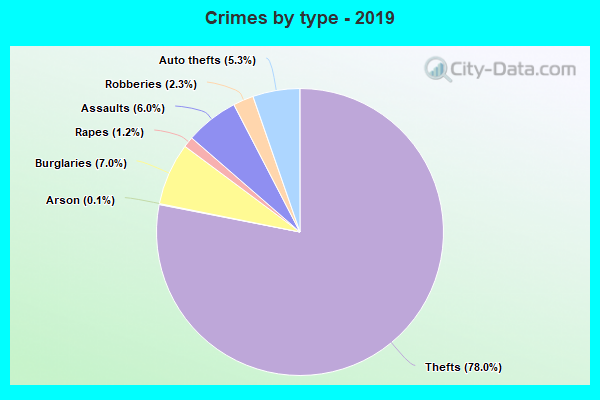
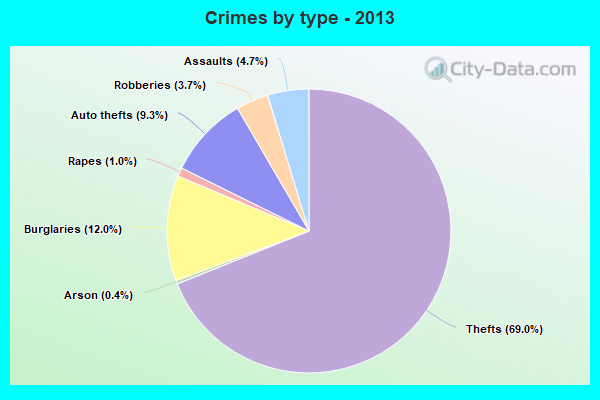
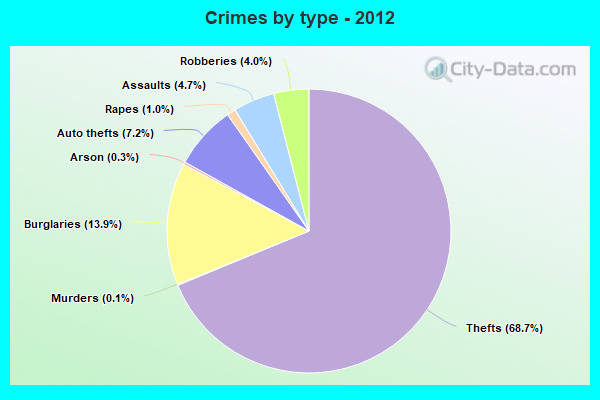
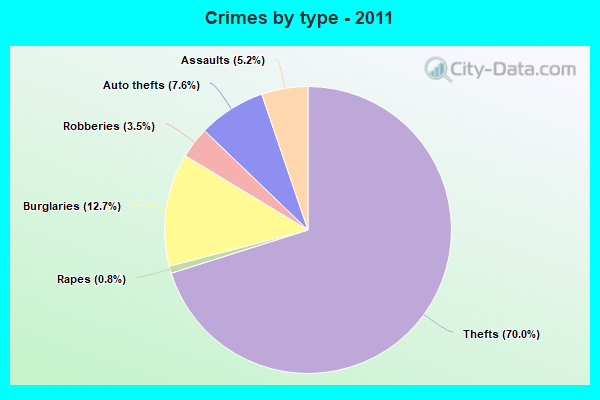
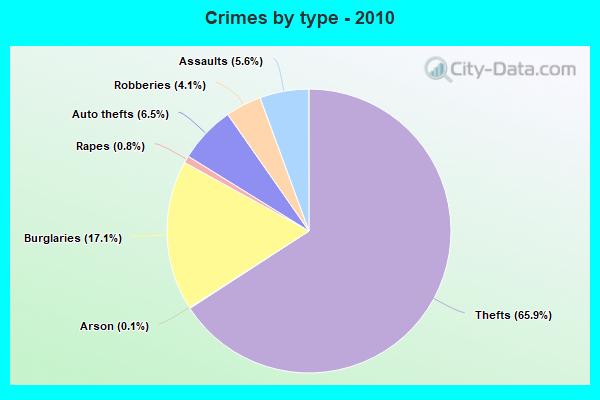
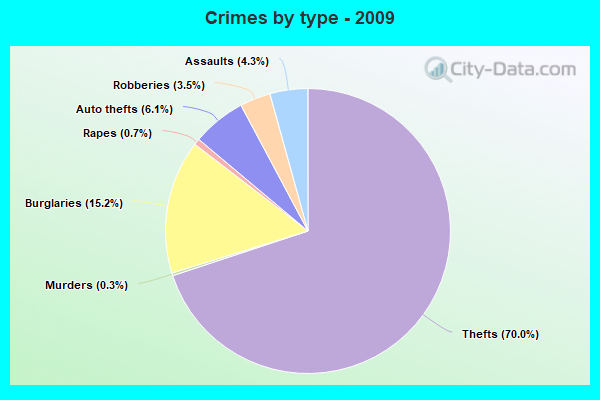
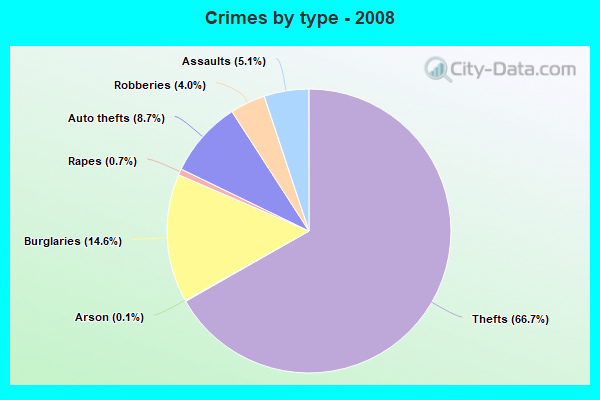
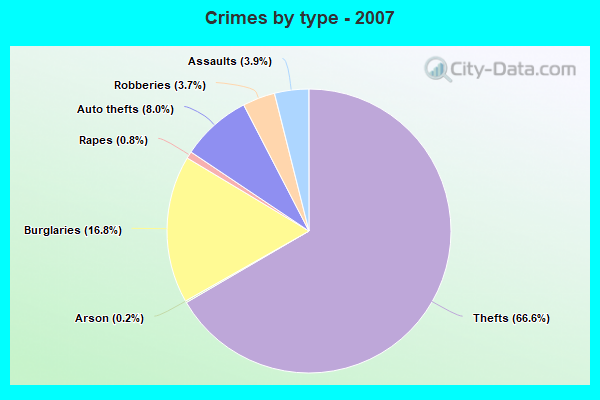
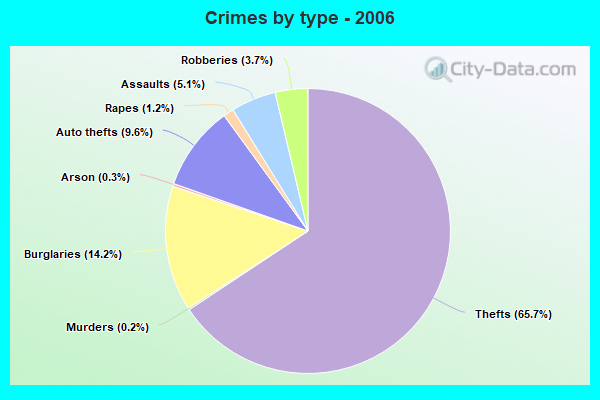
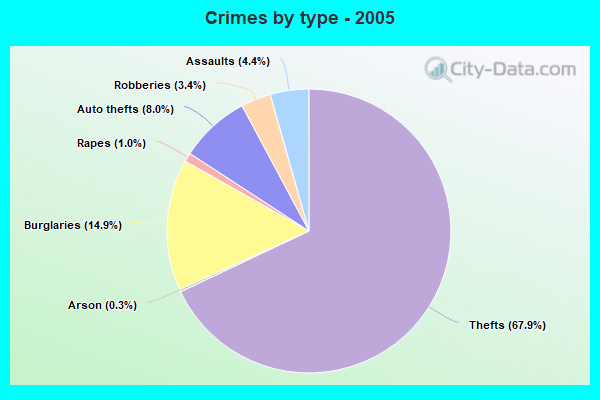
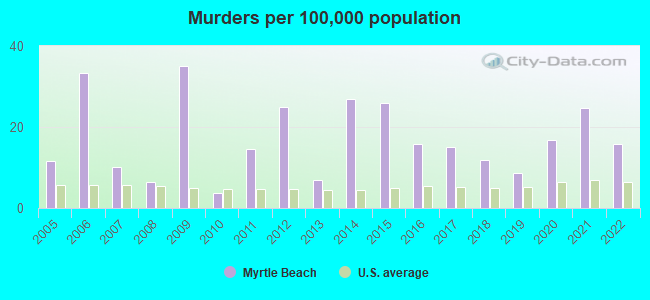
| Murders (per 100,000) | 11 (35.0) | 1 (3.7) | 4 (14.6) | 7 (24.9) | 2 (7.0) | 8 (26.9) | 8 (26.0) | 5 (15.7) | 5 (15.1) | 4 (11.9) | 3 (8.6) | 6 (16.8) | 9 (24.6) | 6 (15.7) |
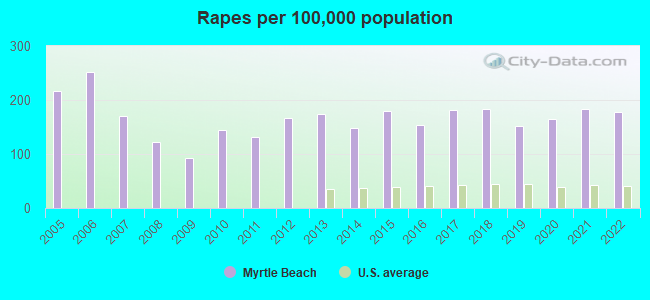
| Rapes (per 100,000) | 29 (92.2) | 39 (143.9) | 36 (131.3) | 47 (167.3) | 50 (174.4) | 44 (148.2) | 55 (179.0) | 49 (153.8) | 60 (180.9) | 62 (184.0) | 53 (152.0) | 59 (165.5) | 67 (183.3) | 68 (178.4) |
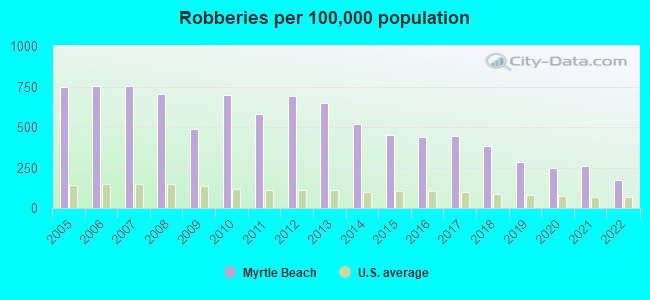
| Robberies (per 100,000) | 154 (489.4) | 189 (697.2) | 160 (583.4) | 195 (694.3) | 186 (648.9) | 154 (518.8) | 139 (452.3) | 139 (436.2) | 147 (443.2) | 129 (382.9) | 98 (281.1) | 87 (244.0) | 94 (257.2) | 65 (170.5) |
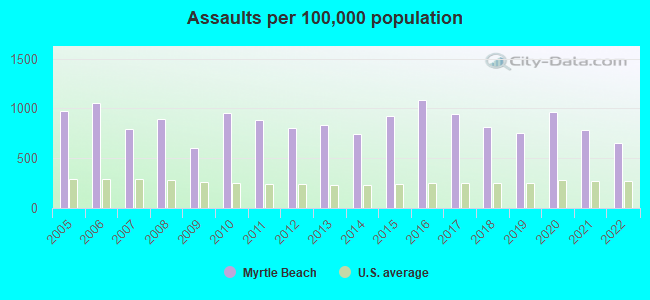
| Assaults (per 100,000) | 189 (600.7) | 259 (955.4) | 243 (886.1) | 227 (808.3) | 239 (833.8) | 221 (744.5) | 283 (920.9) | 346 (1,086) | 312 (940.7) | 275 (816.3) | 262 (751.6) | 344 (964.7) | 285 (779.9) | 247 (648.0) |
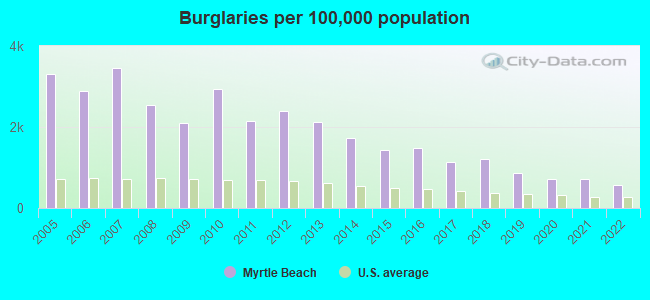
| Burglaries (per 100,000) | 664 (2,110) | 796 (2,936) | 590 (2,151) | 671 (2,389) | 608 (2,121) | 512 (1,725) | 443 (1,442) | 470 (1,475) | 379 (1,143) | 411 (1,220) | 304 (872.1) | 259 (726.3) | 265 (725.2) | 218 (571.9) |
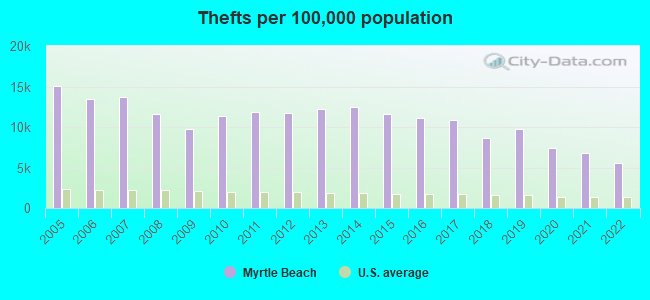
| Thefts (per 100,000) | 3,062 (9,731) | 3,066 (11,310) | 3,247 (11,840) | 3,309 (11,782) | 3,503 (12,221) | 3,687 (12,420) | 3,585 (11,666) | 3,558 (11,166) | 3,620 (10,914) | 2,892 (8,585) | 3,388 (9,719) | 2,629 (7,373) | 2,493 (6,822) | 2,138 (5,609) |
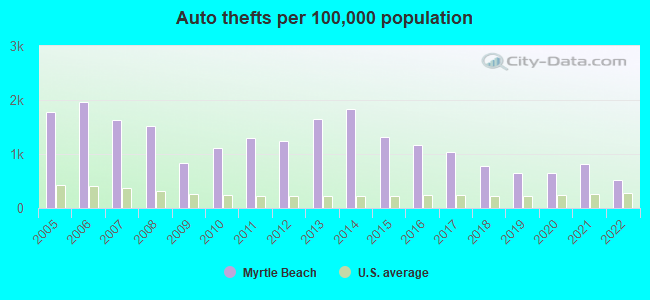
| Auto thefts (per 100,000) | 265 (842.2) | 301 (1,110) | 354 (1,291) | 346 (1,232) | 470 (1,640) | 545 (1,836) | 405 (1,318) | 373 (1,171) | 346 (1,043) | 261 (774.8) | 228 (654.0) | 233 (653.4) | 300 (821.0) | 197 (516.8) |
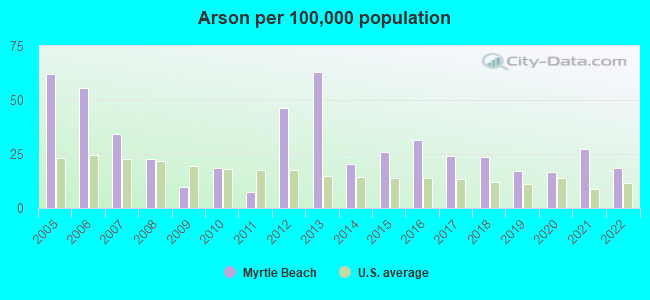
| Arson (per 100,000) | 3 (9.5) | 5 (18.4) | 2 (7.3) | 13 (46.3) | 18 (62.8) | 6 (20.2) | 8 (26.0) | 10 (31.4) | 8 (24.1) | 8 (23.7) | 6 (17.2) | 6 (16.8) | 10 (27.4) | 7 (18.4) |
| City-Data.com crime index | 1015.0 | 1269.5 | 1213.9 | 1290.8 | 1283.5 | 1241.4 | 1188.1 | 1146.0 | 1096.0 | 939.9 | 875.6 | 830.2 | 818.4 | 660.7 |
The City-Data.com crime index weighs serious crimes and violent crimes more heavily. Higher means more crime, U.S. average is 246.1. It adjusts for the number of visitors and daily workers commuting into cities.
According to our research of South Carolina and other state lists, there were 294 registered sex offenders living in Myrtle Beach, South Carolina as of July 04, 2024.
The ratio of all residents to sex offenders in Myrtle Beach is 110 to 1.
Violent crime rate in 2022
| Myrtle Beach: | 619.1 |
| U.S. Average: | 219.8 |
Violent crime rate in 2021
| Myrtle Beach: | 751.2 |
| U.S. Average: | 224.8 |
Violent crime rate in 2020
| Myrtle Beach: | 803.5 |
| U.S. Average: | 228.2 |
Violent crime rate in 2019
| Myrtle Beach: | 685.6 |
| U.S. Average: | 219.9 |
Violent crime rate in 2018
| Myrtle Beach: | 807.4 |
| U.S. Average: | 221.2 |
Violent crime rate in 2017
| Myrtle Beach: | 903.0 |
| U.S. Average: | 226.2 |
Violent crime rate in 2016
| Myrtle Beach: | 946.2 |
| U.S. Average: | 227.3 |
Violent crime rate in 2015
| Myrtle Beach: | 917.6 |
| U.S. Average: | 219.3 |
Violent crime rate in 2014
| Myrtle Beach: | 833.7 |
| U.S. Average: | 211.1 |
Violent crime rate in 2013
| Myrtle Beach: | 929.8 |
| U.S. Average: | 214.2 |
Violent crime rate in 2012
| Myrtle Beach: | 968.5 |
| U.S. Average: | 187.4 |
Violent crime rate in 2011
| Myrtle Beach: | 895.2 |
| U.S. Average: | 187.1 |
Violent crime rate in 2010
| Myrtle Beach: | 977.5 |
| U.S. Average: | 195.7 |
Violent crime rate in 2009
| Myrtle Beach: | 707.1 |
| U.S. Average: | 208.9 |
Violent crime rate in 2008
| Myrtle Beach: | 935.2 |
| U.S. Average: | 222.5 |
Violent crime rate in 2007
| Myrtle Beach: | 176.9 |
| U.S. Average: | 229.1 |
Violent crime rate in 2006
| Myrtle Beach: | 223.2 |
| U.S. Average: | 232.6 |
Violent crime rate in 2005
| Myrtle Beach: | 201.4 |
| U.S. Average: | 227.0 |
Property crime rate in 2022
| Myrtle Beach: | 472.4 |
| U.S. Average: | 166.5 |
Property crime rate in 2021
| Myrtle Beach: | 609.3 |
| U.S. Average: | 157.8 |
Property crime rate in 2020
| Myrtle Beach: | 611.9 |
| U.S. Average: | 169.6 |
Property crime rate in 2019
| Myrtle Beach: | 758.5 |
| U.S. Average: | 179.7 |
Property crime rate in 2018
| Myrtle Beach: | 789.5 |
| U.S. Average: | 190.2 |
Property crime rate in 2017
| Myrtle Beach: | 930.7 |
| U.S. Average: | 206.4 |
Property crime rate in 2016
| Myrtle Beach: | 1,028.9 |
| U.S. Average: | 216.6 |
Property crime rate in 2015
| Myrtle Beach: | 1,069.3 |
| U.S. Average: | 221.5 |
Property crime rate in 2014
| Myrtle Beach: | 1,241.3 |
| U.S. Average: | 230.8 |
Property crime rate in 2013
| Myrtle Beach: | 1,281.3 |
| U.S. Average: | 250.4 |
Property crime rate in 2012
| Myrtle Beach: | 1,251.7 |
| U.S. Average: | 267.3 |
Property crime rate in 2011
| Myrtle Beach: | 1,215.9 |
| U.S. Average: | 273.5 |
Property crime rate in 2010
| Myrtle Beach: | 1,319.3 |
| U.S. Average: | 276.4 |
Property crime rate in 2009
| Myrtle Beach: | 1,035.0 |
| U.S. Average: | 285.6 |
Property crime rate in 2008
| Myrtle Beach: | 1,313.9 |
| U.S. Average: | 302.2 |
Property crime rate in 2007
| Myrtle Beach: | 295.7 |
| U.S. Average: | 309.2 |
Property crime rate in 2006
| Myrtle Beach: | 282.7 |
| U.S. Average: | 317.3 |
Property crime rate in 2005
| Myrtle Beach: | 307.8 |
| U.S. Average: | 322.3 |
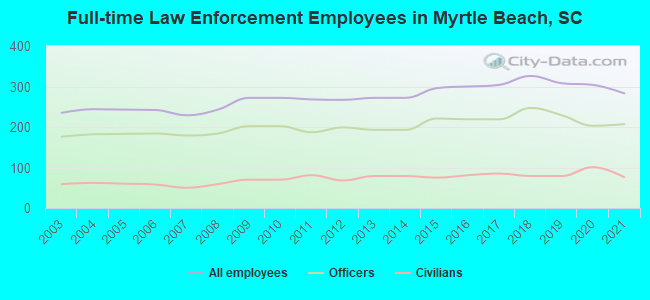
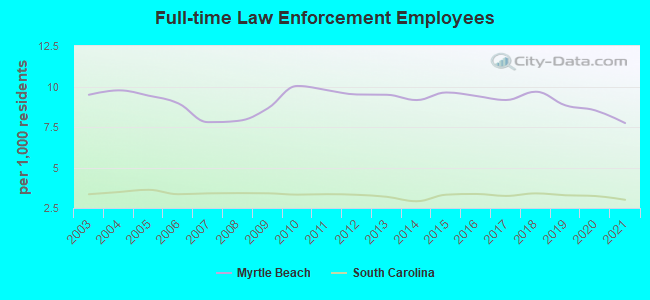
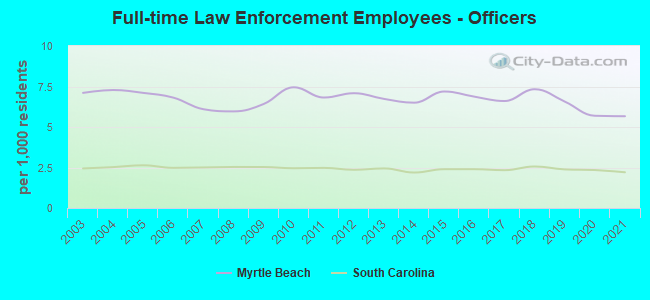
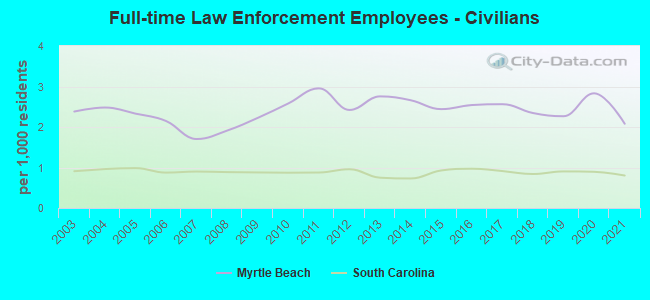
Full-time law enforcement employees in 2021, including police officers: 283 (207 officers - 180 male; 27 female).
| Officers per 1,000 residents here: | 5.66 |
| South Carolina average: | 2.21 |
Full-time law enforcement employees in 2020, including police officers: 304 (203 officers - 177 male; 26 female).
| Officers per 1,000 residents here: | 5.69 |
| South Carolina average: | 2.34 |
Full-time law enforcement employees in 2019, including police officers: 308 (229 officers - 201 male; 28 female).
| Officers per 1,000 residents here: | 6.57 |
| South Carolina average: | 2.38 |
Full-time law enforcement employees in 2018, including police officers: 326 (247 officers - 221 male; 26 female).
| Officers per 1,000 residents here: | 7.33 |
| South Carolina average: | 2.56 |
Full-time law enforcement employees in 2017, including police officers: 304 (219 officers - 189 male; 30 female).
| Officers per 1,000 residents here: | 6.60 |
| South Carolina average: | 2.33 |
Full-time law enforcement employees in 2016, including police officers: 300 (219 officers - 189 male; 30 female).
| Officers per 1,000 residents here: | 6.87 |
| South Carolina average: | 2.40 |
Full-time law enforcement employees in 2015, including police officers: 296 (221 officers - 194 male; 27 female).
| Officers per 1,000 residents here: | 7.19 |
| South Carolina average: | 2.40 |
Full-time law enforcement employees in 2014, including police officers: 272 (193 officers - 170 male; 23 female).
| Officers per 1,000 residents here: | 6.50 |
| South Carolina average: | 2.19 |
Full-time law enforcement employees in 2013, including police officers: 272 (193 officers - 170 male; 23 female).
| Officers per 1,000 residents here: | 6.73 |
| South Carolina average: | 2.44 |
Full-time law enforcement employees in 2012, including police officers: 267 (199 officers - 173 male; 26 female).
| Officers per 1,000 residents here: | 7.09 |
| South Carolina average: | 2.36 |
Full-time law enforcement employees in 2011, including police officers: 268 (187 officers - 166 male; 21 female).
| Officers per 1,000 residents here: | 6.82 |
| South Carolina average: | 2.48 |
Full-time law enforcement employees in 2010, including police officers: 272 (202 officers - 176 male; 26 female).
| Officers per 1,000 residents here: | 7.45 |
| South Carolina average: | 2.45 |
Full-time law enforcement employees in 2009, including police officers: 272 (202 officers - 176 male; 26 female).
| Officers per 1,000 residents here: | 6.42 |
| South Carolina average: | 2.53 |
Full-time law enforcement employees in 2008, including police officers: 243 (184 officers - 163 male; 21 female).
| Officers per 1,000 residents here: | 5.96 |
| South Carolina average: | 2.53 |
Full-time law enforcement employees in 2007, including police officers: 229 (179 officers - 157 male; 22 female).
| Officers per 1,000 residents here: | 6.10 |
| South Carolina average: | 2.50 |
Full-time law enforcement employees in 2006, including police officers: 242 (184 officers - 159 male; 25 female).
| Officers per 1,000 residents here: | 6.81 |
| South Carolina average: | 2.48 |
Full-time law enforcement employees in 2005, including police officers: 243 (183 officers - 159 male; 24 female).
| Officers per 1,000 residents here: | 7.11 |
| South Carolina average: | 2.64 |
Full-time law enforcement employees in 2004, including police officers: 244 (182 officers - 159 male; 23 female).
| Officers per 1,000 residents here: | 7.28 |
| South Carolina average: | 2.52 |
Full-time law enforcement employees in 2003, including police officers: 235 (176 officers - 153 male; 23 female).
| Officers per 1,000 residents here: | 7.11 |
| South Carolina average: | 2.44 |