Crime rate in Mesquite, Texas (TX): murders, rapes, robberies, assaults, burglaries, thefts, auto thefts, arson, law enforcement employees, police officers, crime map
Crime rate in Mesquite, TX
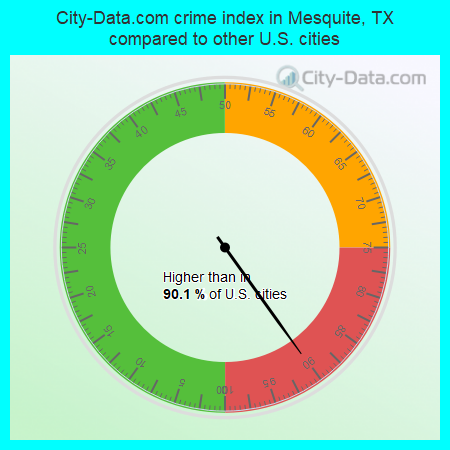
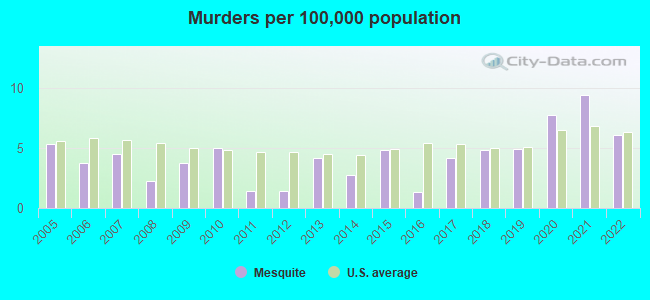
The 2022 crime rate in Mesquite, TX is 325 (City-Data.com crime index), which is 1.3 times greater than the U.S. average. It was higher than in 90.1% U.S. cities. The 2022 Mesquite crime rate fell by 2% compared to 2021. The number of homicides stood at 9 - a decrease of 4 compared to 2021. In the last 5 years Mesquite has seen increasing violent crime and rise of property crime.See how dangerous Mesquite, TX is compared to the nearest cities:
(Note: Higher means more crime)
(Note: Higher means more crime)
| Mesquite: | 325.4 |
| Sunnyvale: | 88.8 |
| Balch Springs: | 323.3 |
| Forney: | 105.5 |
| Garland: | 210.7 |
| Heath: | 80.9 |
| Rowlett: | 139.2 |
| Seagoville: | 179.5 |
| Dallas: | 427.1 |
The City-Data.com crime index weighs serious crimes and violent crimes more heavily. Higher means more crime, U.S. average is 246.1. It adjusts for the number of visitors and daily workers commuting into cities.
- means the value is smaller than the state average.- means the value is about the same as the state average.
- means the value is bigger than the state average.
- means the value is much bigger than the state average.
According to our research of Texas and other state lists, there were 181 registered sex offenders living in Mesquite, Texas as of May 16, 2024.
The ratio of all residents to sex offenders in Mesquite is 794 to 1.
The ratio of registered sex offenders to all residents in this city is lower than the state average.
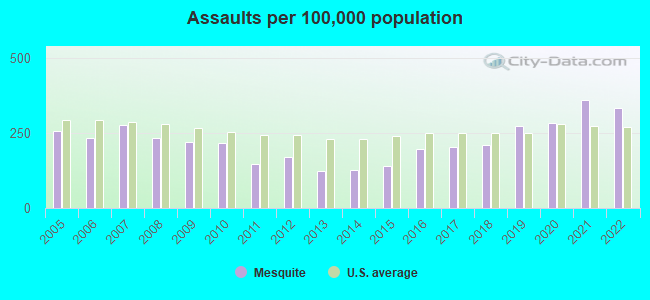
Violent crime rate in 2022
| Mesquite: | 261.8 |
| U.S. Average: | 219.8 |
Violent crime rate in 2021
| Mesquite: | 297.2 |
| U.S. Average: | 224.8 |
Violent crime rate in 2020
| Mesquite: | 259.0 |
| U.S. Average: | 228.2 |
Violent crime rate in 2019
| Mesquite: | 263.5 |
| U.S. Average: | 219.9 |
Violent crime rate in 2018
| Mesquite: | 223.8 |
| U.S. Average: | 221.2 |
Violent crime rate in 2017
| Mesquite: | 245.1 |
| U.S. Average: | 226.2 |
Violent crime rate in 2016
| Mesquite: | 231.5 |
| U.S. Average: | 227.3 |
Violent crime rate in 2015
| Mesquite: | 190.3 |
| U.S. Average: | 219.3 |
Violent crime rate in 2014
| Mesquite: | 172.1 |
| U.S. Average: | 211.1 |
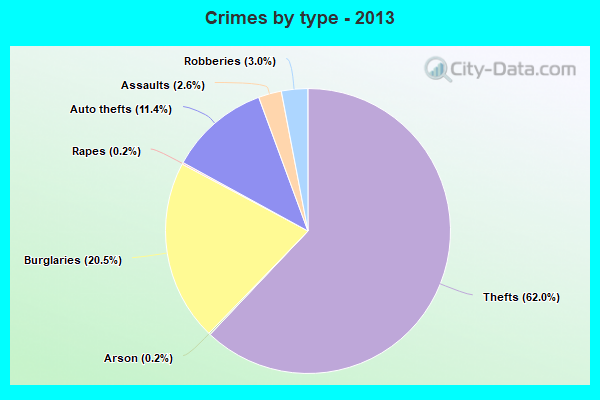
Violent crime rate in 2013
| Mesquite: | 150.4 |
| U.S. Average: | 214.2 |
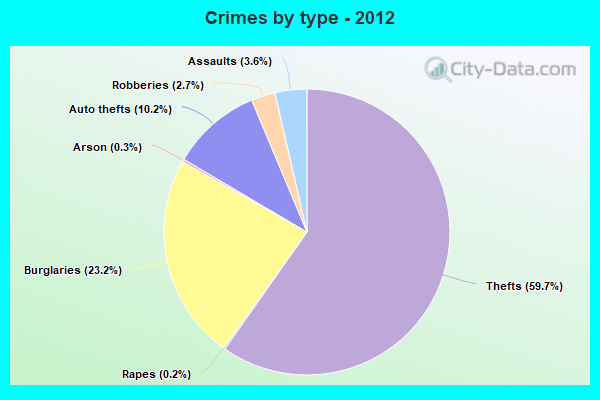
Violent crime rate in 2012
| Mesquite: | 159.5 |
| U.S. Average: | 187.4 |
Violent crime rate in 2011
| Mesquite: | 143.9 |
| U.S. Average: | 187.1 |
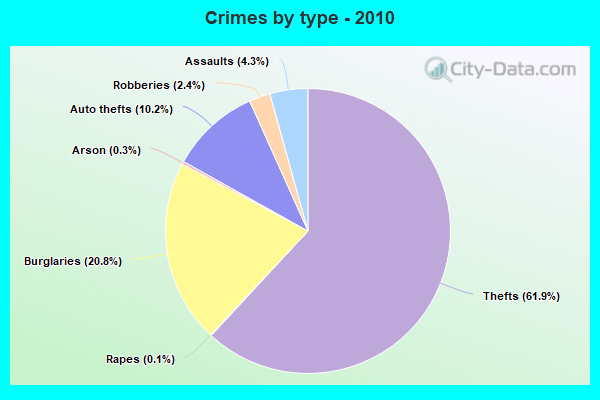
Violent crime rate in 2010
| Mesquite: | 182.7 |
| U.S. Average: | 195.7 |
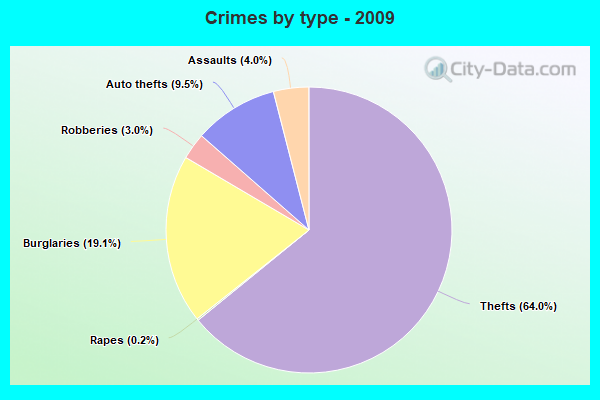
Violent crime rate in 2009
| Mesquite: | 212.9 |
| U.S. Average: | 208.9 |
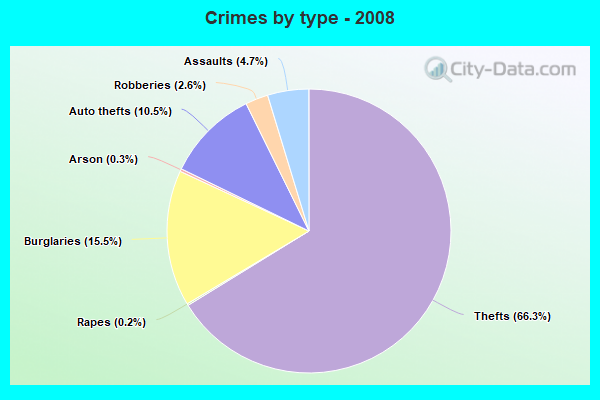
Violent crime rate in 2008
| Mesquite: | 192.7 |
| U.S. Average: | 222.5 |
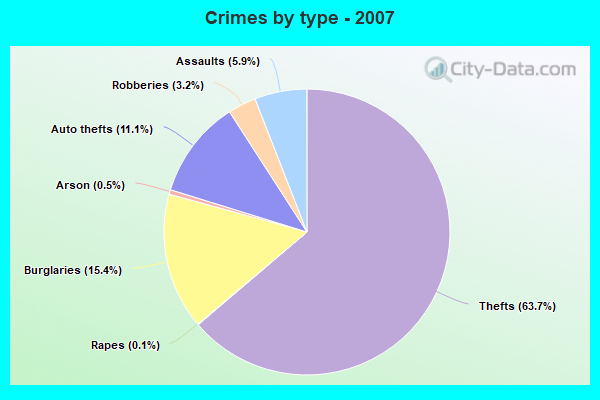
Violent crime rate in 2007
| Mesquite: | 222.6 |
| U.S. Average: | 229.1 |
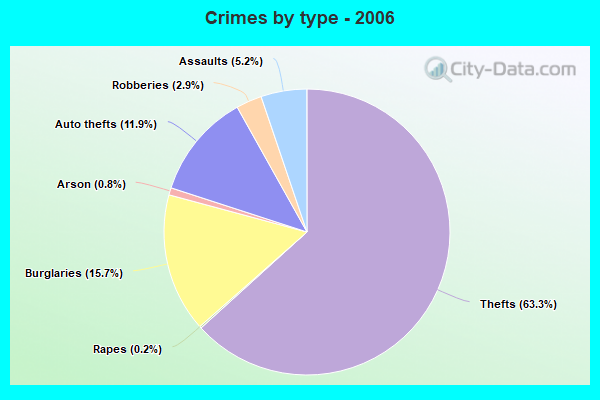
Violent crime rate in 2006
| Mesquite: | 190.6 |
| U.S. Average: | 232.6 |
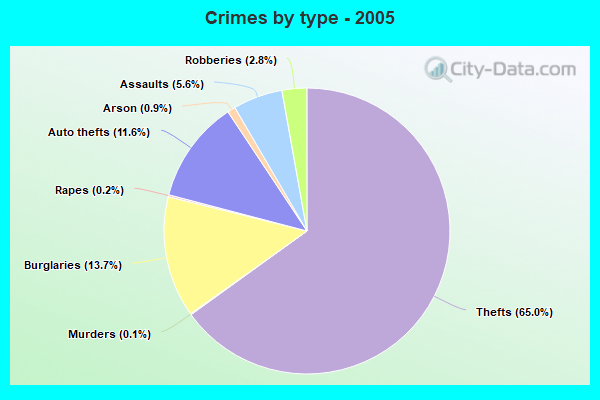
Violent crime rate in 2005
| Mesquite: | 209.8 |
| U.S. Average: | 227.0 |
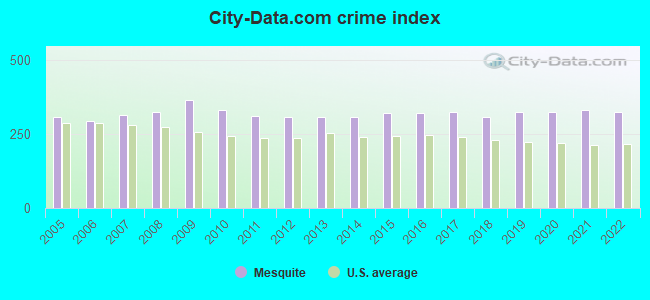
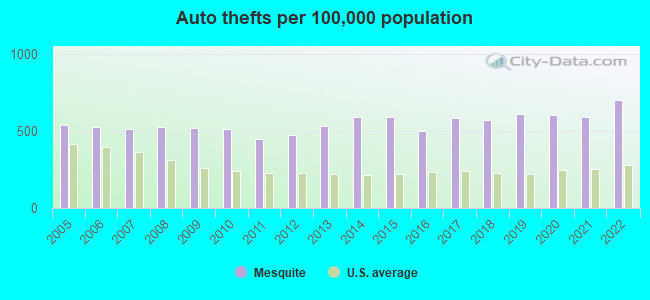
Property crime rate in 2022
| Mesquite: | 326.0 |
| U.S. Average: | 166.5 |
Property crime rate in 2021
| Mesquite: | 292.2 |
| U.S. Average: | 157.8 |
Property crime rate in 2020
| Mesquite: | 315.4 |
| U.S. Average: | 169.6 |
Property crime rate in 2019
| Mesquite: | 312.4 |
| U.S. Average: | 179.7 |
Property crime rate in 2018
| Mesquite: | 322.6 |
| U.S. Average: | 190.2 |
Property crime rate in 2017
| Mesquite: | 321.4 |
| U.S. Average: | 206.4 |
Property crime rate in 2016
| Mesquite: | 338.6 |
| U.S. Average: | 216.6 |
Property crime rate in 2015
| Mesquite: | 380.5 |
| U.S. Average: | 221.5 |
Property crime rate in 2014
| Mesquite: | 383.7 |
| U.S. Average: | 230.8 |
Property crime rate in 2013
| Mesquite: | 416.1 |
| U.S. Average: | 250.4 |
Property crime rate in 2012
| Mesquite: | 426.9 |
| U.S. Average: | 267.3 |
Property crime rate in 2011
| Mesquite: | 453.0 |
| U.S. Average: | 273.5 |
Property crime rate in 2010
| Mesquite: | 440.4 |
| U.S. Average: | 276.4 |
Property crime rate in 2009
| Mesquite: | 462.0 |
| U.S. Average: | 285.6 |
Property crime rate in 2008
| Mesquite: | 400.0 |
| U.S. Average: | 302.2 |
Property crime rate in 2007
| Mesquite: | 359.6 |
| U.S. Average: | 309.2 |
Property crime rate in 2006
| Mesquite: | 349.8 |
| U.S. Average: | 317.3 |
Property crime rate in 2005
| Mesquite: | 349.9 |
| U.S. Average: | 322.3 |
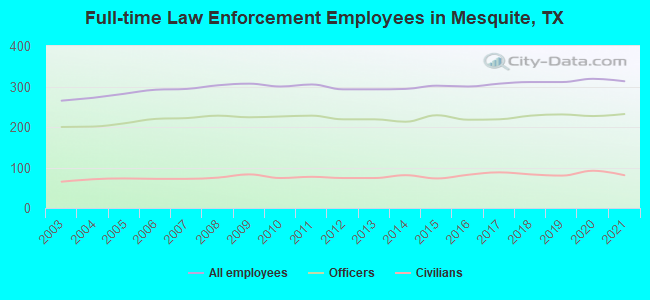
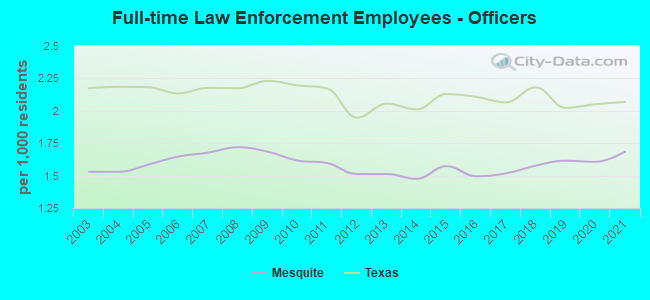
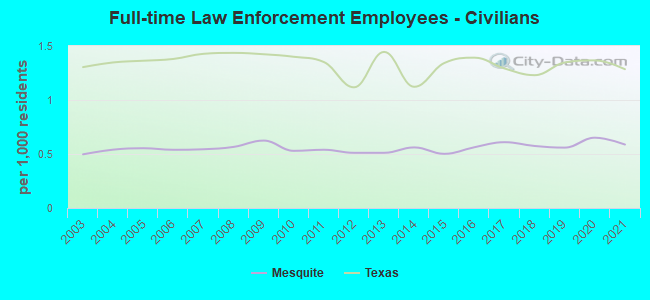
Full-time law enforcement employees in 2021, including police officers: 313 (232 officers - 214 male; 18 female).
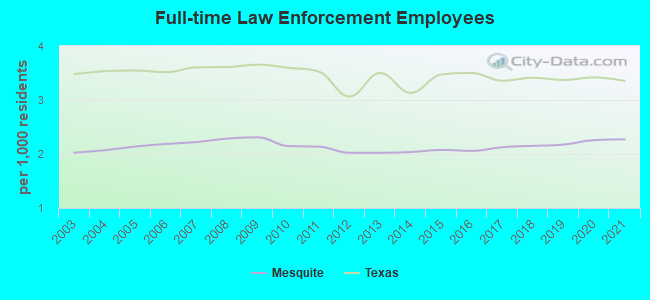
| Officers per 1,000 residents here: | 1.68 |
| Texas average: | 2.07 |
Full-time law enforcement employees in 2020, including police officers: 319 (227 officers - 215 male; 12 female).
| Officers per 1,000 residents here: | 1.61 |
| Texas average: | 2.05 |
Full-time law enforcement employees in 2019, including police officers: 311 (231 officers - 218 male; 13 female).
| Officers per 1,000 residents here: | 1.61 |
| Texas average: | 2.02 |
Full-time law enforcement employees in 2018, including police officers: 311 (228 officers - 217 male; 11 female).
| Officers per 1,000 residents here: | 1.58 |
| Texas average: | 2.18 |
Full-time law enforcement employees in 2017, including police officers: 307 (219 officers - 207 male; 12 female).
| Officers per 1,000 residents here: | 1.52 |
| Texas average: | 2.06 |
Full-time law enforcement employees in 2016, including police officers: 300 (218 officers - 207 male; 11 female).
| Officers per 1,000 residents here: | 1.50 |
| Texas average: | 2.11 |
Full-time law enforcement employees in 2015, including police officers: 302 (229 officers - 216 male; 13 female).
| Officers per 1,000 residents here: | 1.57 |
| Texas average: | 2.13 |
Full-time law enforcement employees in 2014, including police officers: 294 (213 officers - 205 male; 8 female).
| Officers per 1,000 residents here: | 1.48 |
| Texas average: | 2.01 |
Full-time law enforcement employees in 2012, including police officers: 293 (219 officers - 212 male; 7 female).
| Officers per 1,000 residents here: | 1.51 |
| Texas average: | 1.95 |
Full-time law enforcement employees in 2011, including police officers: 305 (228 officers - 220 male; 8 female).
| Officers per 1,000 residents here: | 1.60 |
| Texas average: | 2.17 |
Full-time law enforcement employees in 2010, including police officers: 300 (226 officers - 219 male; 7 female).
| Officers per 1,000 residents here: | 1.62 |
| Texas average: | 2.20 |
Full-time law enforcement employees in 2009, including police officers: 307 (224 officers - 216 male; 8 female).
| Officers per 1,000 residents here: | 1.68 |
| Texas average: | 2.23 |
Full-time law enforcement employees in 2008, including police officers: 303 (228 officers - 220 male; 8 female).
| Officers per 1,000 residents here: | 1.72 |
| Texas average: | 2.17 |
Full-time law enforcement employees in 2007, including police officers: 294 (222 officers - 214 male; 8 female).
| Officers per 1,000 residents here: | 1.68 |
| Texas average: | 2.18 |
Full-time law enforcement employees in 2006, including police officers: 292 (220 officers - 212 male; 8 female).
| Officers per 1,000 residents here: | 1.65 |
| Texas average: | 2.13 |
Full-time law enforcement employees in 2005, including police officers: 282 (209 officers - 203 male; 6 female).
| Officers per 1,000 residents here: | 1.59 |
| Texas average: | 2.18 |
Full-time law enforcement employees in 2004, including police officers: 272 (201 officers - 195 male; 6 female).
| Officers per 1,000 residents here: | 1.53 |
| Texas average: | 2.19 |
Full-time law enforcement employees in 2003, including police officers: 265 (200 officers - 193 male; 7 female).
| Officers per 1,000 residents here: | 1.53 |
| Texas average: | 2.17 |


Zip codes: 75149.