Crime rate in Mesa, Arizona (AZ): murders, rapes, robberies, assaults, burglaries, thefts, auto thefts, arson, law enforcement employees, police officers, crime map
Crime rate in Mesa, AZ
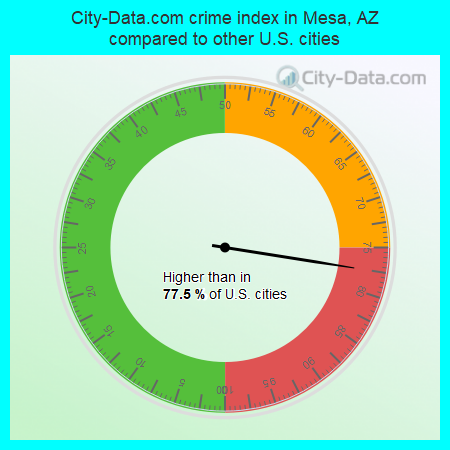
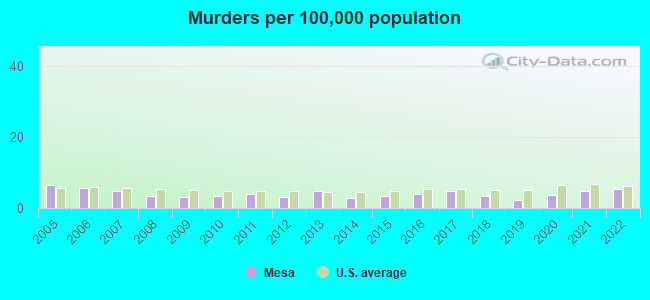
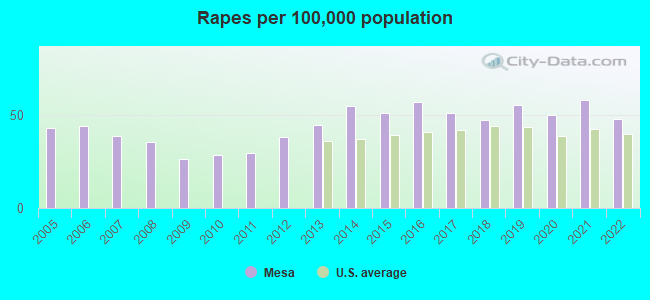
The 2022 crime rate in Mesa, AZ is 215 (City-Data.com crime index), which is comparable to the U.S. average. It was higher than in 77.5% U.S. cities. The 2022 Mesa crime rate fell by 5% compared to 2021. The number of homicides stood at 27 - an increase of 2 compared to 2021. In the last 5 years Mesa has seen rise of violent crime and decreasing property crime.See how dangerous Mesa, AZ is compared to the nearest cities:
(Note: Higher means more crime)
(Note: Higher means more crime)
| Mesa: | 215.2 |
| Gilbert: | 88.4 |
| Chandler: | 150.0 |
| Tempe: | 388.1 |
| Apache Junction: | 203.0 |
| Queen Creek: | 87.4 |
| Scottsdale: | 146.3 |
| Paradise Valley: | 117.8 |
| Phoenix: | 395.1 |
The City-Data.com crime index weighs serious crimes and violent crimes more heavily. Higher means more crime, U.S. average is 246.1. It adjusts for the number of visitors and daily workers commuting into cities.
- means the value is smaller than the state average.- means the value is about the same as the state average.
- means the value is bigger than the state average.
- means the value is much bigger than the state average.
According to our research of Arizona and other state lists, there were 635 registered sex offenders living in Mesa, Arizona as of May 03, 2024.
The ratio of all residents to sex offenders in Mesa is 763 to 1.
The ratio of registered sex offenders to all residents in this city is near the state average.
Violent crime rate in 2022
| Mesa: | 245.5 |
| U.S. Average: | 219.8 |
Violent crime rate in 2021
| Mesa: | 242.0 |
| U.S. Average: | 224.8 |
Violent crime rate in 2020
| Mesa: | 219.5 |
| U.S. Average: | 228.2 |
Violent crime rate in 2019
| Mesa: | 219.2 |
| U.S. Average: | 219.9 |
Violent crime rate in 2018
| Mesa: | 210.5 |
| U.S. Average: | 221.2 |
Violent crime rate in 2017
| Mesa: | 240.5 |
| U.S. Average: | 226.2 |
Violent crime rate in 2016
| Mesa: | 248.8 |
| U.S. Average: | 227.3 |
Violent crime rate in 2015
| Mesa: | 240.0 |
| U.S. Average: | 219.3 |
Violent crime rate in 2014
| Mesa: | 260.8 |
| U.S. Average: | 211.1 |
Violent crime rate in 2013
| Mesa: | 227.6 |
| U.S. Average: | 214.2 |
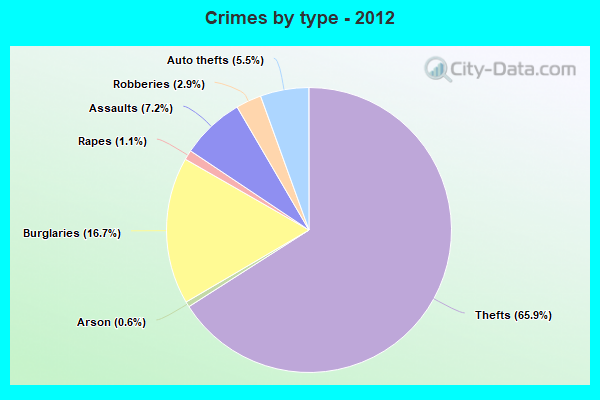
Violent crime rate in 2012
| Mesa: | 223.5 |
| U.S. Average: | 187.4 |
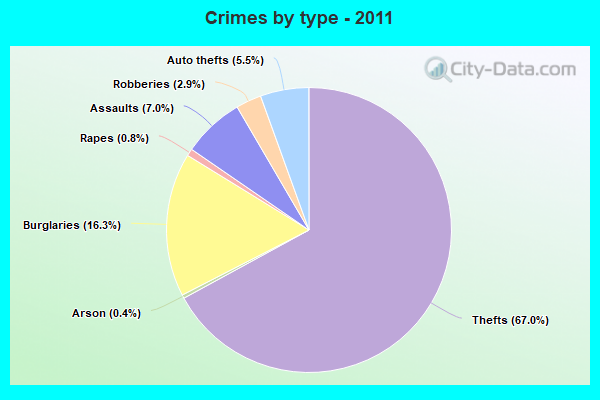
Violent crime rate in 2011
| Mesa: | 226.7 |
| U.S. Average: | 187.1 |
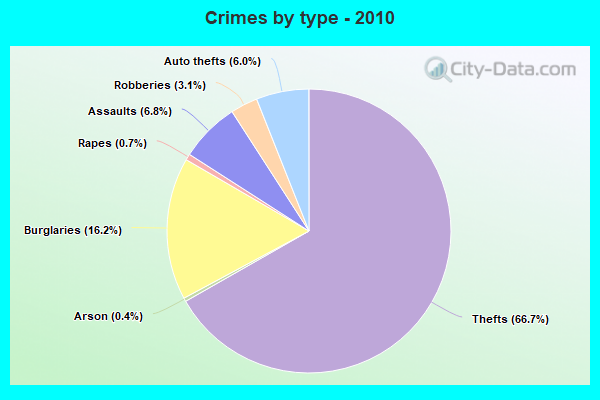
Violent crime rate in 2010
| Mesa: | 223.1 |
| U.S. Average: | 195.7 |
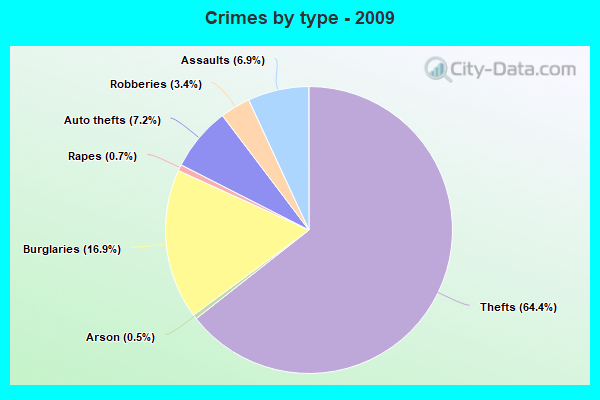
Violent crime rate in 2009
| Mesa: | 229.9 |
| U.S. Average: | 208.9 |
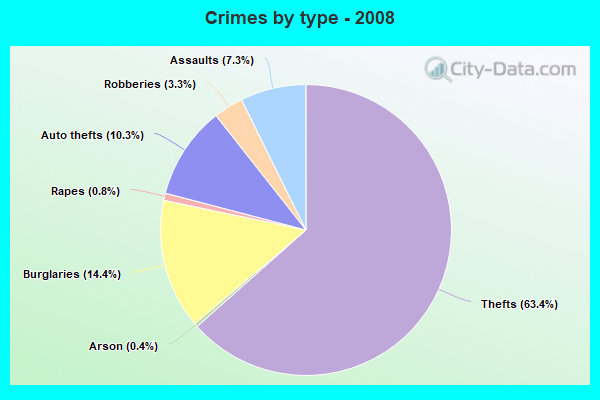
Violent crime rate in 2008
| Mesa: | 273.4 |
| U.S. Average: | 222.5 |
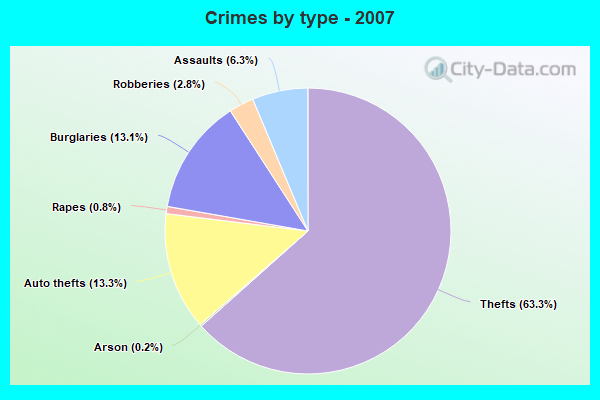
Violent crime rate in 2007
| Mesa: | 242.8 |
| U.S. Average: | 229.1 |
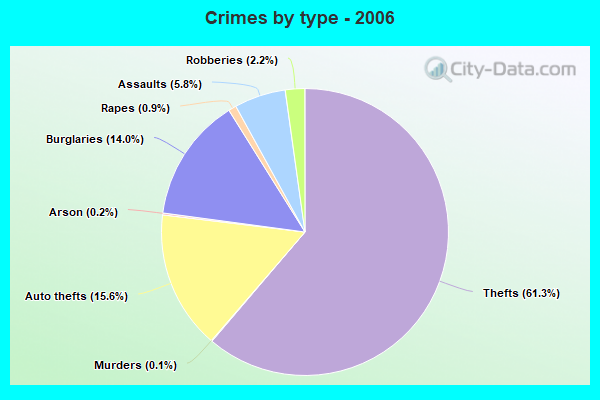
Violent crime rate in 2006
| Mesa: | 230.3 |
| U.S. Average: | 232.6 |
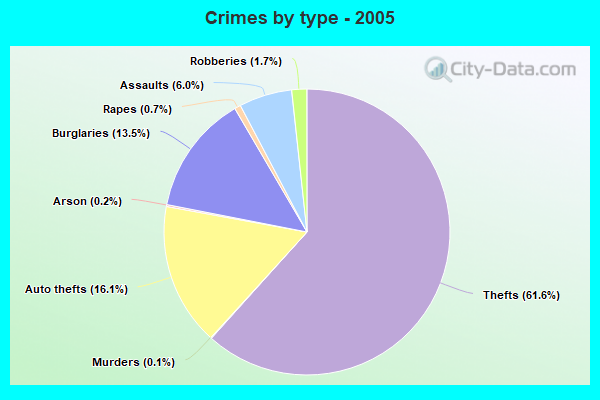
Violent crime rate in 2005
| Mesa: | 253.5 |
| U.S. Average: | 227.0 |
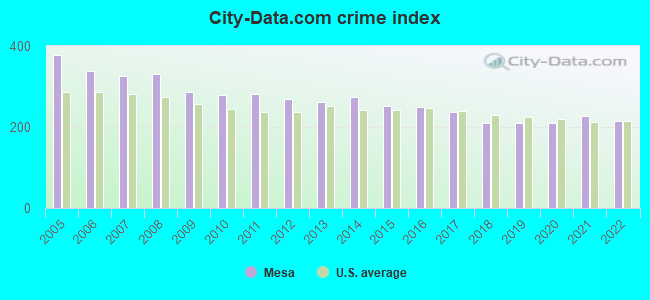
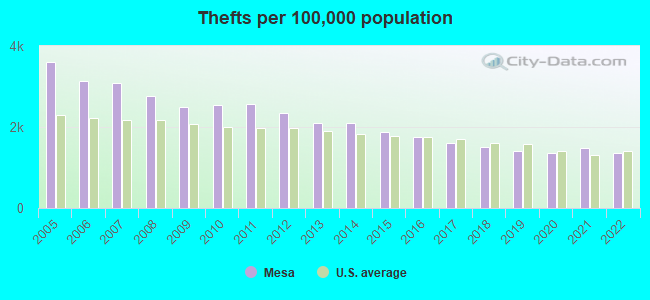
Property crime rate in 2022
| Mesa: | 141.3 |
| U.S. Average: | 166.5 |
Property crime rate in 2021
| Mesa: | 159.8 |
| U.S. Average: | 157.8 |
Property crime rate in 2020
| Mesa: | 157.9 |
| U.S. Average: | 169.6 |
Property crime rate in 2019
| Mesa: | 153.6 |
| U.S. Average: | 179.7 |
Property crime rate in 2018
| Mesa: | 162.8 |
| U.S. Average: | 190.2 |
Property crime rate in 2017
| Mesa: | 183.8 |
| U.S. Average: | 206.4 |
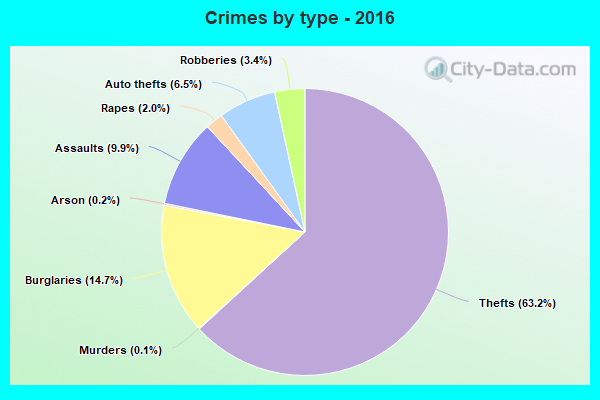
Property crime rate in 2016
| Mesa: | 196.4 |
| U.S. Average: | 216.6 |
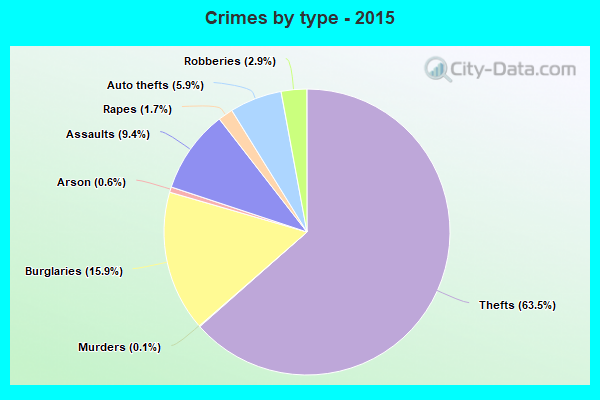
Property crime rate in 2015
| Mesa: | 214.5 |
| U.S. Average: | 221.5 |
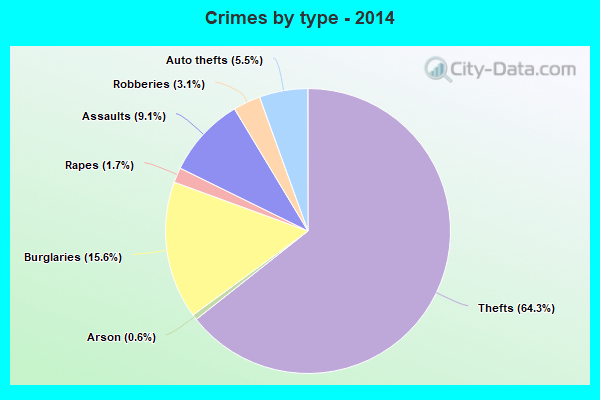
Property crime rate in 2014
| Mesa: | 234.7 |
| U.S. Average: | 230.8 |
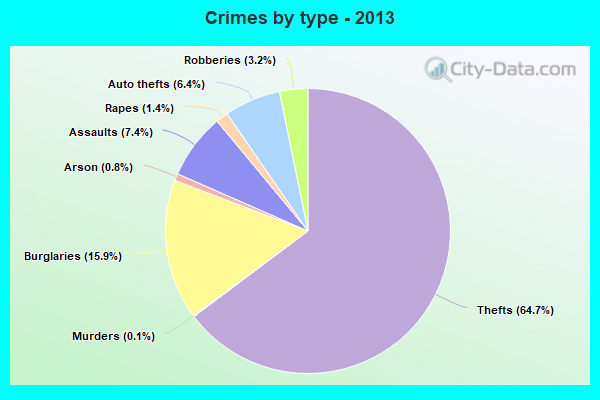
Property crime rate in 2013
| Mesa: | 240.0 |
| U.S. Average: | 250.4 |
Property crime rate in 2012
| Mesa: | 265.4 |
| U.S. Average: | 267.3 |
Property crime rate in 2011
| Mesa: | 284.2 |
| U.S. Average: | 273.5 |
Property crime rate in 2010
| Mesa: | 285.0 |
| U.S. Average: | 276.4 |
Property crime rate in 2009
| Mesa: | 296.4 |
| U.S. Average: | 285.6 |
Property crime rate in 2008
| Mesa: | 330.6 |
| U.S. Average: | 302.2 |
Property crime rate in 2007
| Mesa: | 341.1 |
| U.S. Average: | 309.2 |
Property crime rate in 2006
| Mesa: | 374.6 |
| U.S. Average: | 317.3 |
Property crime rate in 2005
| Mesa: | 428.1 |
| U.S. Average: | 322.3 |
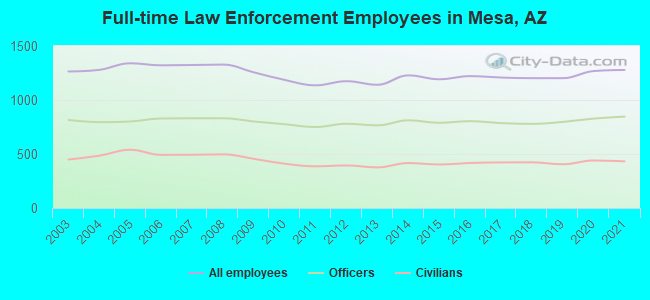
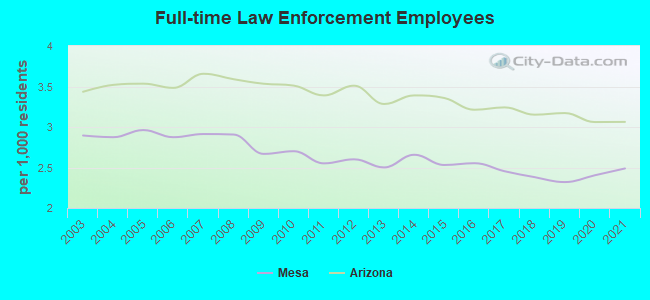
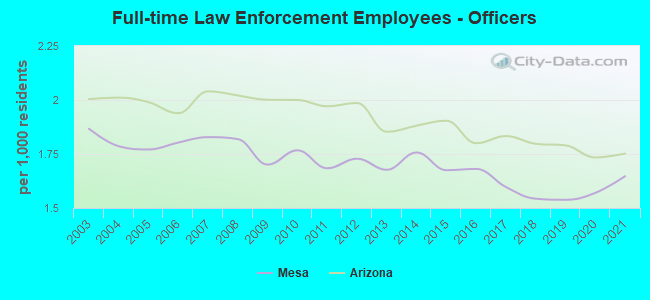
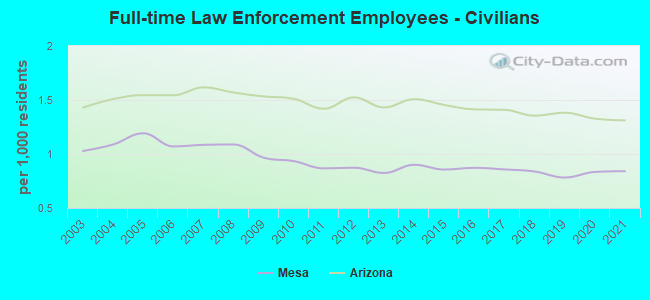
Full-time law enforcement employees in 2021, including police officers: 1,278 (846 officers - 739 male; 107 female).
| Officers per 1,000 residents here: | 1.65 |
| Arizona average: | 1.75 |
Full-time law enforcement employees in 2020, including police officers: 1,268 (828 officers - 727 male; 101 female).
| Officers per 1,000 residents here: | 1.57 |
| Arizona average: | 1.73 |
Full-time law enforcement employees in 2019, including police officers: 1,202 (797 officers - 699 male; 98 female).
| Officers per 1,000 residents here: | 1.54 |
| Arizona average: | 1.79 |
Full-time law enforcement employees in 2018, including police officers: 1,202 (779 officers - 683 male; 96 female).
| Officers per 1,000 residents here: | 1.54 |
| Arizona average: | 1.80 |
Full-time law enforcement employees in 2017, including police officers: 1,208 (786 officers - 695 male; 91 female).
| Officers per 1,000 residents here: | 1.60 |
| Arizona average: | 1.83 |
Full-time law enforcement employees in 2016, including police officers: 1,221 (804 officers - 712 male; 92 female).
| Officers per 1,000 residents here: | 1.68 |
| Arizona average: | 1.80 |
Full-time law enforcement employees in 2015, including police officers: 1,192 (789 officers - 700 male; 89 female).
| Officers per 1,000 residents here: | 1.68 |
| Arizona average: | 1.90 |
Full-time law enforcement employees in 2014, including police officers: 1,228 (812 officers - 720 male; 92 female).
| Officers per 1,000 residents here: | 1.76 |
| Arizona average: | 1.88 |
Full-time law enforcement employees in 2013, including police officers: 1,141 (765 officers - 678 male; 87 female).
| Officers per 1,000 residents here: | 1.68 |
| Arizona average: | 1.85 |
Full-time law enforcement employees in 2012, including police officers: 1,174 (780 officers - 692 male; 88 female).
| Officers per 1,000 residents here: | 1.73 |
| Arizona average: | 1.99 |
Full-time law enforcement employees in 2011, including police officers: 1,136 (750 officers - 670 male; 80 female).
| Officers per 1,000 residents here: | 1.68 |
| Arizona average: | 1.97 |
Full-time law enforcement employees in 2010, including police officers: 1,186 (776 officers - 693 male; 83 female).
| Officers per 1,000 residents here: | 1.77 |
| Arizona average: | 2.00 |
Full-time law enforcement employees in 2009, including police officers: 1,256 (801 officers - 717 male; 84 female).
| Officers per 1,000 residents here: | 1.70 |
| Arizona average: | 2.00 |
Full-time law enforcement employees in 2008, including police officers: 1,328 (831 officers - 744 male; 87 female).
| Officers per 1,000 residents here: | 1.82 |
| Arizona average: | 2.02 |
Full-time law enforcement employees in 2007, including police officers: 1,324 (831 officers - 747 male; 84 female).
| Officers per 1,000 residents here: | 1.83 |
| Arizona average: | 2.04 |
Full-time law enforcement employees in 2006, including police officers: 1,321 (829 officers - 753 male; 76 female).
| Officers per 1,000 residents here: | 1.80 |
| Arizona average: | 1.94 |
Full-time law enforcement employees in 2005, including police officers: 1,340 (801 officers - 721 male; 80 female).
| Officers per 1,000 residents here: | 1.77 |
| Arizona average: | 1.99 |
Full-time law enforcement employees in 2004, including police officers: 1,279 (795 officers - 712 male; 83 female).
| Officers per 1,000 residents here: | 1.79 |
| Arizona average: | 2.01 |
Full-time law enforcement employees in 2003, including police officers: 1,264 (815 officers - 733 male; 82 female).
| Officers per 1,000 residents here: | 1.87 |
| Arizona average: | 2.00 |

Zip codes: 85201, 85202, 85203, 85205, 85207, 85208, 85210, 85213, 85215, 85281.