Crime rate in Lanesboro, Pennsylvania (PA): murders, rapes, robberies, assaults, burglaries, thefts, auto thefts, arson, crime map
Crime rate in Lanesboro, PA
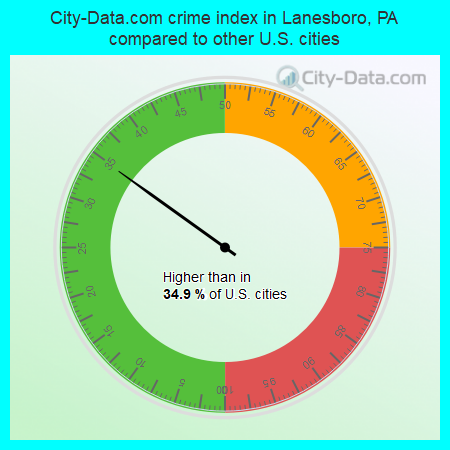
The 2019 crime rate in Lanesboro, PA is 62 (City-Data.com crime index), which is 4.0 times smaller than the U.S. average. It was higher than in 34.9% U.S. cities. The 2019 Lanesboro crime rate fell by 67% compared to 2018. In the last 5 years Lanesboro has seen decline of violent crime and decline of property crime.See how dangerous Lanesboro, PA is compared to the nearest cities:
(Note: Higher means more crime)
(Note: Higher means more crime)
| Lanesboro: | 62.2 |
| Hancock: | 42.7 |
| Montrose: | 27.4 |
| Afton: | 18.6 |
| Binghamton: | 347.3 |
| Port Dickinson: | 6.5 |
| Johnson City: | 317.3 |
| Forest City: | 30.4 |
| Bainbridge: | 11.5 |
Type |
2009 |
2010 |
2011 |
2013 |
2014 |
2018 |
2019 |
|---|---|---|---|---|---|---|---|
| Murders (per 100,000) | 0 (0.0) | 0 (0.0) | 0 (0.0) | 0 (0.0) | 0 (0.0) | 0 (0.0) | 0 (0.0) |
| Rapes (per 100,000) | 0 (0.0) | 0 (0.0) | 0 (0.0) | 0 (0.0) | 0 (0.0) | 0 (0.0) | 0 (0.0) |
| Robberies (per 100,000) | 0 (0.0) | 0 (0.0) | 0 (0.0) | 0 (0.0) | 0 (0.0) | 0 (0.0) | 0 (0.0) |
| Assaults (per 100,000) | 0 (0.0) | 0 (0.0) | 0 (0.0) | 1 (202.8) | 1 (206.2) | 4 (860.2) | 1 (222.2) |
| Burglaries (per 100,000) | 0 (0.0) | 0 (0.0) | 2 (393.7) | 0 (0.0) | 0 (0.0) | 1 (215.1) | 0 (0.0) |
| Thefts (per 100,000) | 1 (182.8) | 0 (0.0) | 0 (0.0) | 0 (0.0) | 0 (0.0) | 0 (0.0) | 0 (0.0) |
| Auto thefts (per 100,000) | 0 (0.0) | 0 (0.0) | 0 (0.0) | 0 (0.0) | 0 (0.0) | 0 (0.0) | 1 (222.2) |
| Arson (per 100,000) | 0 (0.0) | 0 (0.0) | 0 (0.0) | 0 (0.0) | 0 (0.0) | 0 (0.0) | 0 (0.0) |
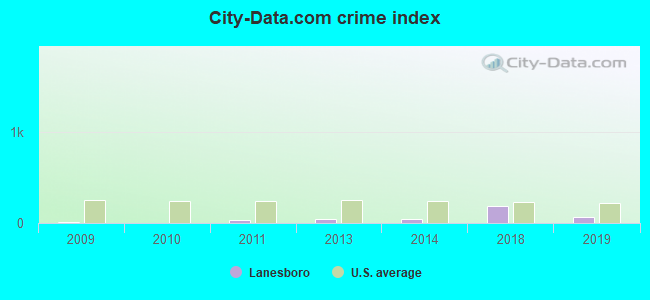
| City-Data.com crime index | 7.3 | 0.0 | 27.6 | 40.6 | 41.2 | 187.1 | 62.2 |
The City-Data.com crime index weighs serious crimes and violent crimes more heavily. Higher means more crime, U.S. average is 246.1. It adjusts for the number of visitors and daily workers commuting into cities.
Violent crime rate in 2019
| Lanesboro: | 111.1 |
| U.S. Average: | 219.9 |
Violent crime rate in 2018
| Lanesboro: | 430.1 |
| U.S. Average: | 221.2 |
Violent crime rate in 2014
| Lanesboro: | 103.1 |
| U.S. Average: | 211.1 |
Violent crime rate in 2013
| Lanesboro: | 101.4 |
| U.S. Average: | 214.2 |
Violent crime rate in 2011
| Lanesboro: | 0.0 |
| U.S. Average: | 187.1 |
Violent crime rate in 2010
| Lanesboro: | 0.0 |
| U.S. Average: | 195.7 |
Violent crime rate in 2009
| Lanesboro: | 0.0 |
| U.S. Average: | 208.9 |
Property crime rate in 2019
| Lanesboro: | 33.3 |
| U.S. Average: | 179.7 |
Property crime rate in 2018
| Lanesboro: | 43.0 |
| U.S. Average: | 190.2 |
Property crime rate in 2014
| Lanesboro: | 0.0 |
| U.S. Average: | 230.8 |
Property crime rate in 2013
| Lanesboro: | 0.0 |
| U.S. Average: | 250.4 |
Property crime rate in 2011
| Lanesboro: | 78.7 |
| U.S. Average: | 273.5 |
Property crime rate in 2010
| Lanesboro: | 0.0 |
| U.S. Average: | 276.4 |
Property crime rate in 2009
| Lanesboro: | 9.1 |
| U.S. Average: | 285.6 |


Zip codes: 18847.