Crime rate in Kansas City, Kansas (KS): murders, rapes, robberies, assaults, burglaries, thefts, auto thefts, arson, law enforcement employees, police officers, crime map
Crime rate in Kansas City, KS
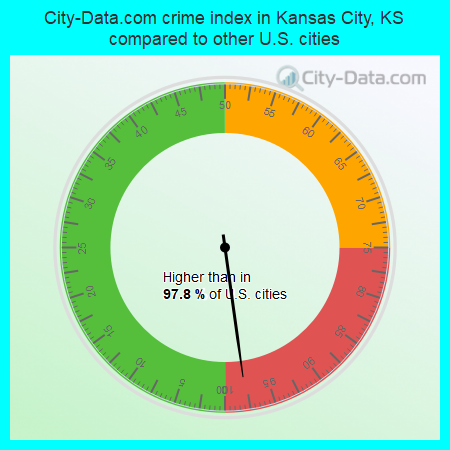
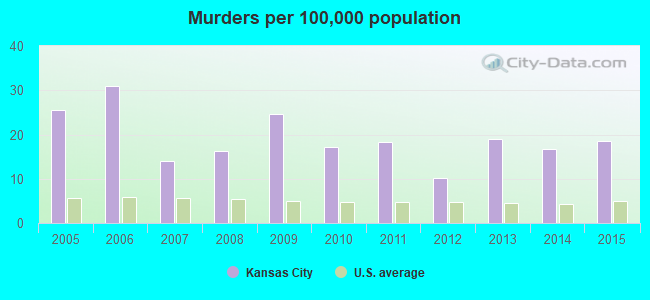
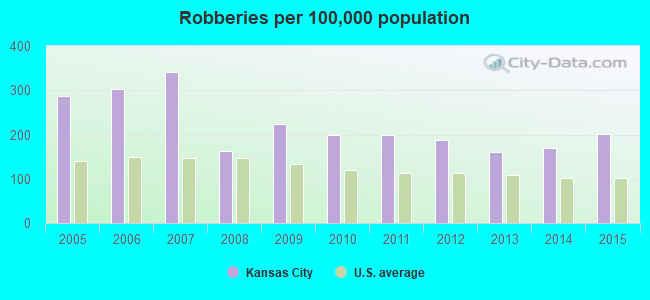
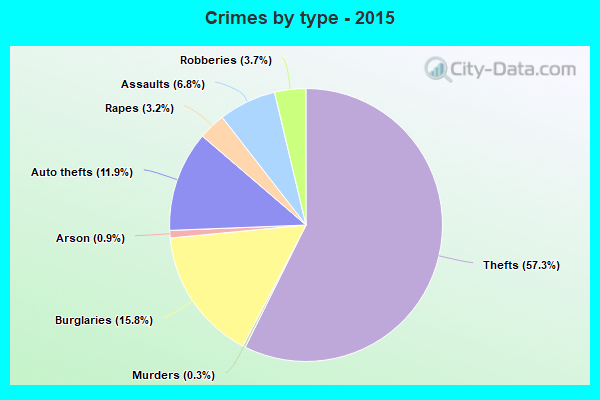
The 2015 crime rate in Kansas City, KS is 554 (City-Data.com crime index), which is 2.3 times higher than the U.S. average. It was higher than in 97.8% U.S. cities. The 2015 Kansas City crime rate rose by 3% compared to 2014. The number of homicides stood at 28 - an increase of 3 compared to 2014. In the last 5 years Kansas City has seen rise of violent crime and decline of property crime.See how dangerous Kansas City, KS is compared to the nearest cities:
(Note: Higher means more crime)
(Note: Higher means more crime)
| Kansas City: | 553.9 |
| Roeland Park: | 277.4 |
| Riverside: | 391.6 |
| Mission: | 399.2 |
| Westwood: | 304.2 |
| Westwood Hills: | 270.4 |
| Merriam: | 473.6 |
| North Kansas City: | 931.0 |
| Mission Woods: | 140.7 |
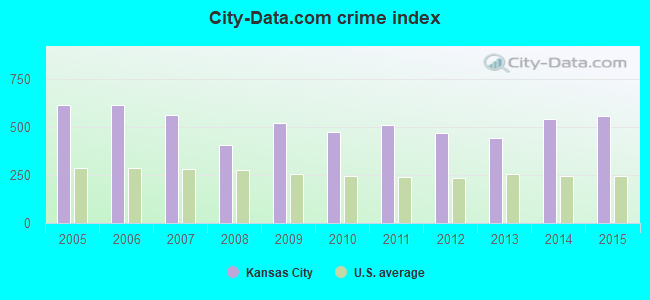
The City-Data.com crime index weighs serious crimes and violent crimes more heavily. Higher means more crime, U.S. average is 246.1. It adjusts for the number of visitors and daily workers commuting into cities.
- means the value is smaller than the state average.- means the value is bigger than the state average.
- means the value is much bigger than the state average.
According to our research of Kansas and other state lists, there were 562 registered sex offenders living in Kansas City, Kansas as of May 05, 2024.
The ratio of all residents to sex offenders in Kansas City is 274 to 1.
The ratio of registered sex offenders to all residents in this city is near the state average.
Violent crime rate in 2015
| Kansas City: | 502.4 |
| U.S. Average: | 219.3 |
Violent crime rate in 2014
| Kansas City: | 458.7 |
| U.S. Average: | 211.1 |
Violent crime rate in 2013
| Kansas City: | 304.2 |
| U.S. Average: | 214.2 |
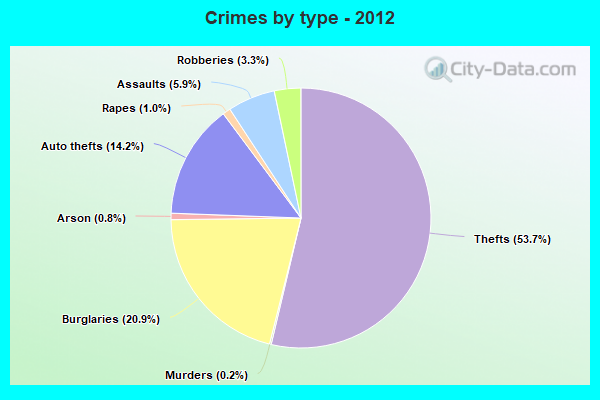
Violent crime rate in 2012
| Kansas City: | 342.0 |
| U.S. Average: | 187.4 |
Violent crime rate in 2011
| Kansas City: | 382.7 |
| U.S. Average: | 187.1 |
Violent crime rate in 2010
| Kansas City: | 329.2 |
| U.S. Average: | 195.7 |
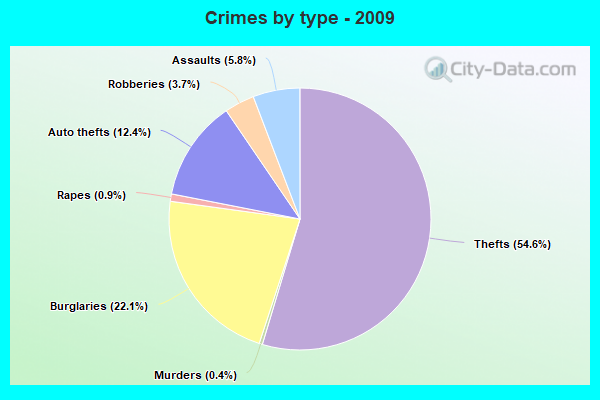
Violent crime rate in 2009
| Kansas City: | 395.8 |
| U.S. Average: | 208.9 |
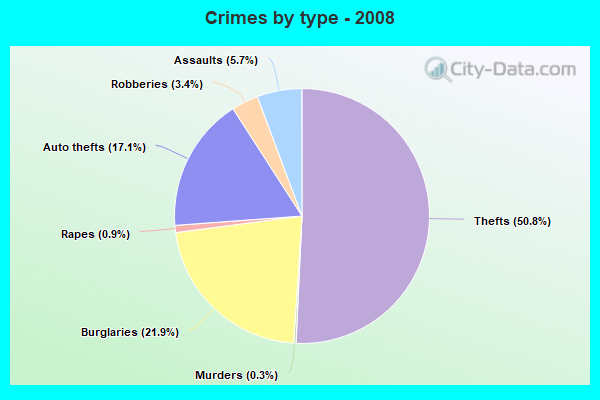
Violent crime rate in 2008
| Kansas City: | 291.0 |
| U.S. Average: | 222.5 |
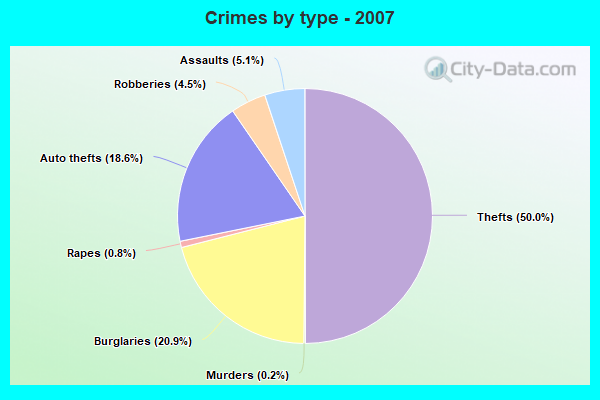
Violent crime rate in 2007
| Kansas City: | 403.5 |
| U.S. Average: | 229.1 |
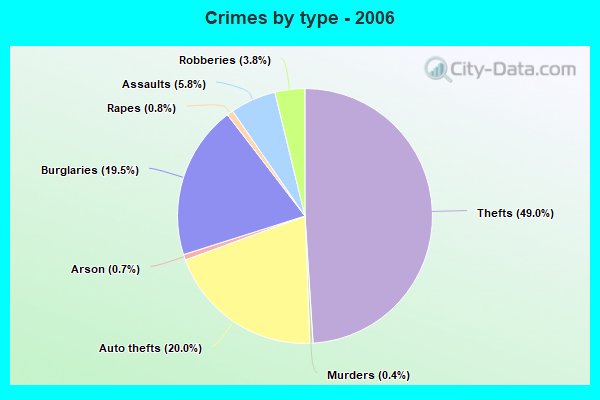
Violent crime rate in 2006
| Kansas City: | 450.7 |
| U.S. Average: | 232.6 |
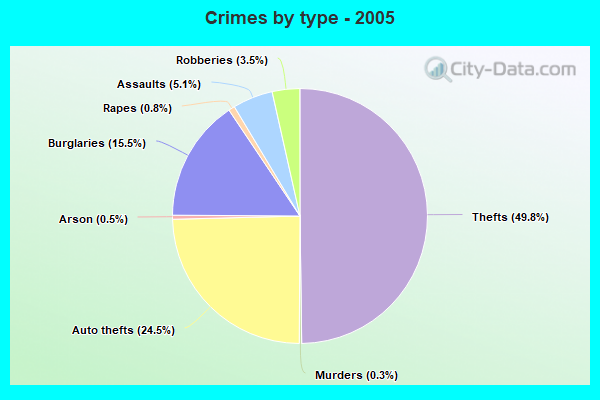
Violent crime rate in 2005
| Kansas City: | 421.1 |
| U.S. Average: | 227.0 |
Property crime rate in 2015
| Kansas City: | 431.1 |
| U.S. Average: | 221.5 |
Property crime rate in 2014
| Kansas City: | 476.8 |
| U.S. Average: | 230.8 |
Property crime rate in 2013
| Kansas City: | 479.9 |
| U.S. Average: | 250.4 |
Property crime rate in 2012
| Kansas City: | 518.7 |
| U.S. Average: | 267.3 |
Property crime rate in 2011
| Kansas City: | 541.6 |
| U.S. Average: | 273.5 |
Property crime rate in 2010
| Kansas City: | 540.5 |
| U.S. Average: | 276.4 |
Property crime rate in 2009
| Kansas City: | 550.9 |
| U.S. Average: | 285.6 |
Property crime rate in 2008
| Kansas City: | 457.1 |
| U.S. Average: | 302.2 |
Property crime rate in 2007
| Kansas City: | 638.0 |
| U.S. Average: | 309.2 |
Property crime rate in 2006
| Kansas City: | 665.7 |
| U.S. Average: | 317.3 |
Property crime rate in 2005
| Kansas City: | 673.7 |
| U.S. Average: | 322.3 |

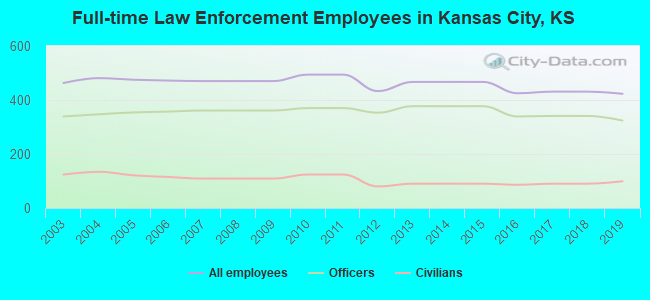
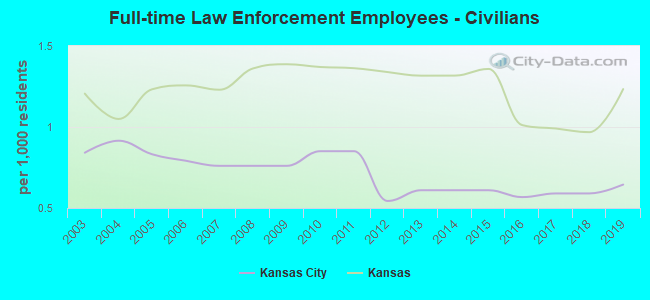
Full-time law enforcement employees in 2019, including police officers: 423 (324 officers - 283 male; 41 female).
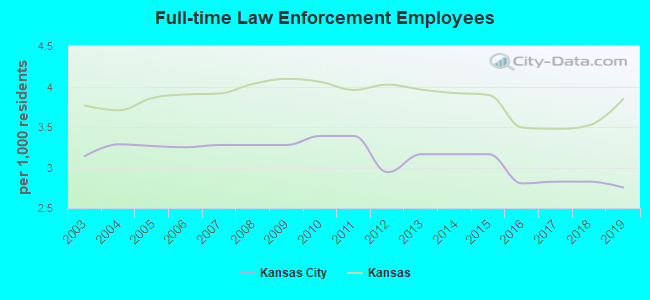
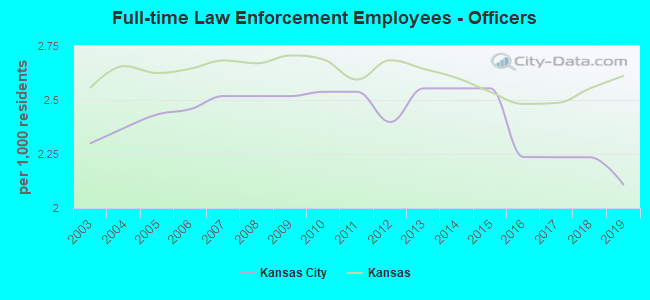
| Officers per 1,000 residents here: | 2.11 |
| Kansas average: | 2.61 |
Full-time law enforcement employees in 2017, including police officers: 431 (341 officers - 297 male; 44 female).
| Officers per 1,000 residents here: | 2.23 |
| Kansas average: | 2.49 |
Full-time law enforcement employees in 2016, including police officers: 425 (339 officers - 299 male; 40 female).
| Officers per 1,000 residents here: | 2.24 |
| Kansas average: | 2.48 |
Full-time law enforcement employees in 2013, including police officers: 467 (377 officers - 331 male; 46 female).
| Officers per 1,000 residents here: | 2.55 |
| Kansas average: | 2.64 |
Full-time law enforcement employees in 2012, including police officers: 433 (353 officers - 313 male; 40 female).
| Officers per 1,000 residents here: | 2.40 |
| Kansas average: | 2.68 |
Full-time law enforcement employees in 2010, including police officers: 494 (370 officers - 329 male; 41 female).
| Officers per 1,000 residents here: | 2.54 |
| Kansas average: | 2.69 |
Full-time law enforcement employees in 2007, including police officers: 470 (361 officers - 328 male; 33 female).
| Officers per 1,000 residents here: | 2.52 |
| Kansas average: | 2.68 |
Full-time law enforcement employees in 2006, including police officers: 472 (357 officers - 322 male; 35 female).
| Officers per 1,000 residents here: | 2.46 |
| Kansas average: | 2.65 |
Full-time law enforcement employees in 2005, including police officers: 475 (354 officers - 321 male; 33 female).
| Officers per 1,000 residents here: | 2.43 |
| Kansas average: | 2.63 |
Full-time law enforcement employees in 2004, including police officers: 481 (347 officers - 316 male; 31 female).
| Officers per 1,000 residents here: | 2.37 |
| Kansas average: | 2.66 |
Full-time law enforcement employees in 2003, including police officers: 463 (339 officers - 308 male; 31 female).
| Officers per 1,000 residents here: | 2.30 |
| Kansas average: | 2.56 |


Zip codes: 66101, 66102, 66103, 66104, 66105, 66106, 66109, 66112, 66115, 66118, 66217.