Crime rate in Houston, Texas (TX): murders, rapes, robberies, assaults, burglaries, thefts, auto thefts, arson, law enforcement employees, police officers, crime map
Crime rate in Houston, TX
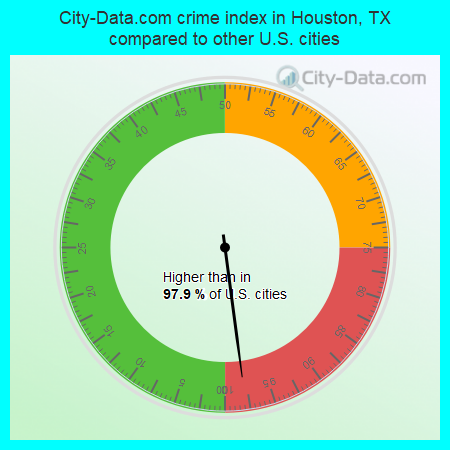
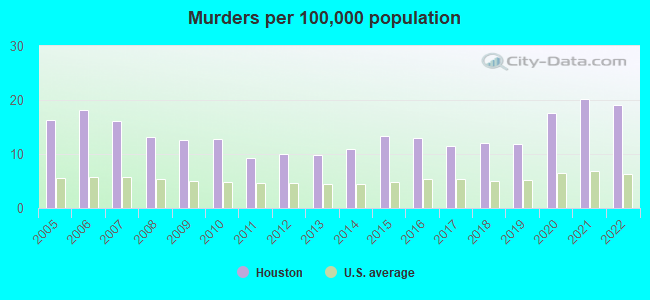
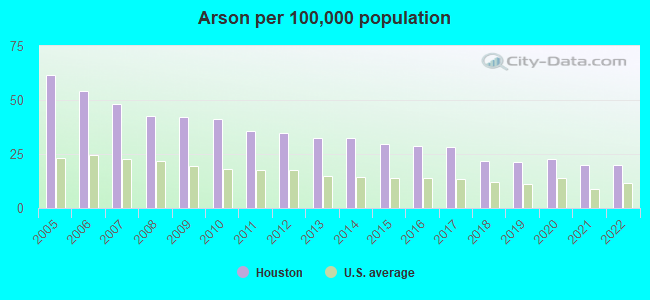
The 2022 crime rate in Houston, TX is 557 (City-Data.com crime index), which is 2.3 times higher than the U.S. average. It was higher than in 97.9% U.S. cities. The 2022 Houston crime rate fell by 0% compared to 2021. The number of homicides stood at 433 - a decrease of 38 compared to 2021. In the last 5 years Houston has seen rise of violent crime and rise of property crime.(Note: Higher means more crime)
| Houston: | 556.6 |
| West University Place: | 67.8 |
| Southside Place: | 118.1 |
| Bellaire: | 166.9 |
| Spring Valley: | 103.6 |
| Hedwig Village: | 327.7 |
| Jacinto City: | 185.3 |
| Galena Park: | 167.7 |
| South Houston: | 385.1 |
The City-Data.com crime index weighs serious crimes and violent crimes more heavily. Higher means more crime, U.S. average is 246.1. It adjusts for the number of visitors and daily workers commuting into cities.
- means the value is about the same as the state average.- means the value is bigger than the state average.
- means the value is much bigger than the state average.
According to our research of Texas and other state lists, there were 7,865 registered sex offenders living in Houston, Texas as of May 25, 2024.
The ratio of all residents to sex offenders in Houston is 293 to 1.
Violent crime rate in 2022
| Houston: | 624.3 |
| U.S. Average: | 219.8 |
Violent crime rate in 2021
| Houston: | 667.9 |
| U.S. Average: | 224.8 |
Violent crime rate in 2020
| Houston: | 687.4 |
| U.S. Average: | 228.2 |
Violent crime rate in 2019
| Houston: | 589.0 |
| U.S. Average: | 219.9 |
Violent crime rate in 2018
| Houston: | 563.0 |
| U.S. Average: | 221.2 |
Violent crime rate in 2017
| Houston: | 594.1 |
| U.S. Average: | 226.2 |
Violent crime rate in 2016
| Houston: | 558.5 |
| U.S. Average: | 227.3 |
Violent crime rate in 2015
| Houston: | 525.0 |
| U.S. Average: | 219.3 |
Violent crime rate in 2014
| Houston: | 530.3 |
| U.S. Average: | 211.1 |
Violent crime rate in 2013
| Houston: | 510.2 |
| U.S. Average: | 214.2 |
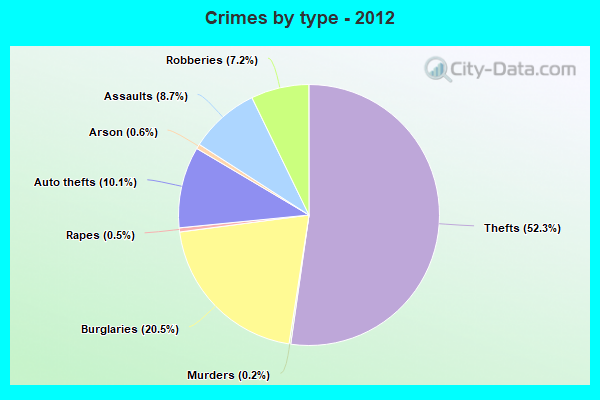
Violent crime rate in 2012
| Houston: | 526.5 |
| U.S. Average: | 187.4 |
Violent crime rate in 2011
| Houston: | 519.1 |
| U.S. Average: | 187.1 |
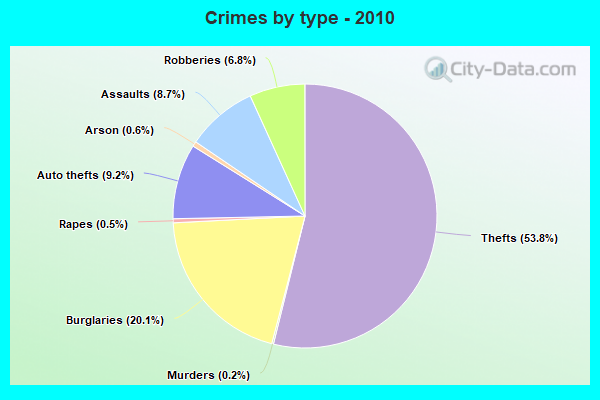
Violent crime rate in 2010
| Houston: | 571.8 |
| U.S. Average: | 195.7 |
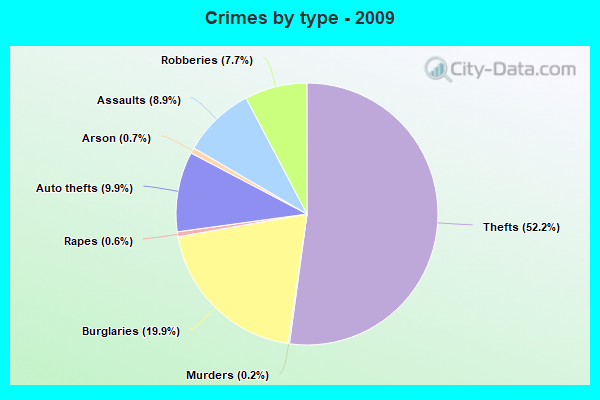
Violent crime rate in 2009
| Houston: | 599.8 |
| U.S. Average: | 208.9 |
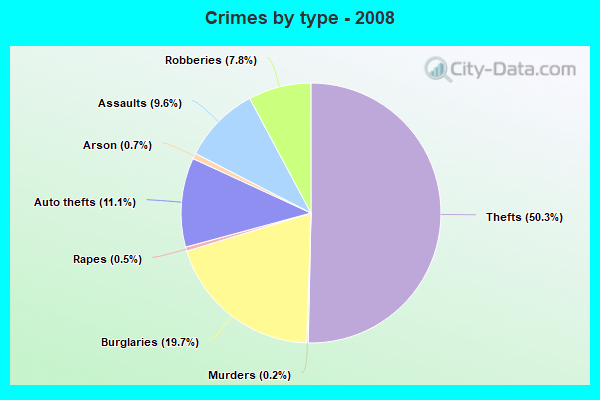
Violent crime rate in 2008
| Houston: | 589.8 |
| U.S. Average: | 222.5 |
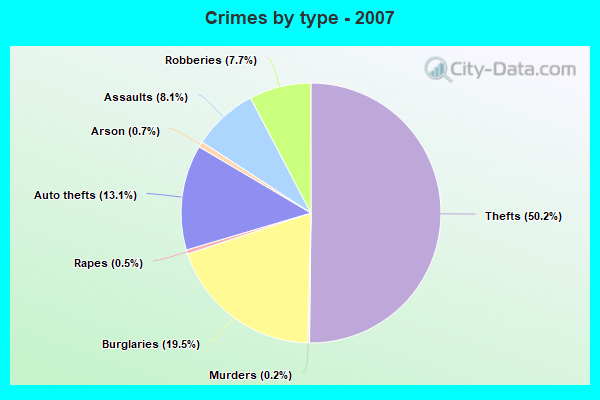
Violent crime rate in 2007
| Houston: | 513.7 |
| U.S. Average: | 229.1 |
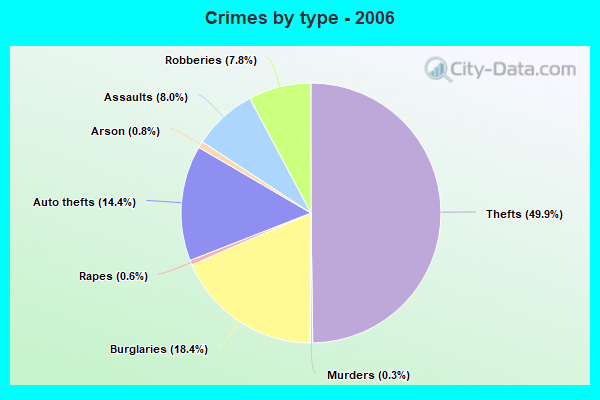
Violent crime rate in 2006
| Houston: | 535.9 |
| U.S. Average: | 232.6 |
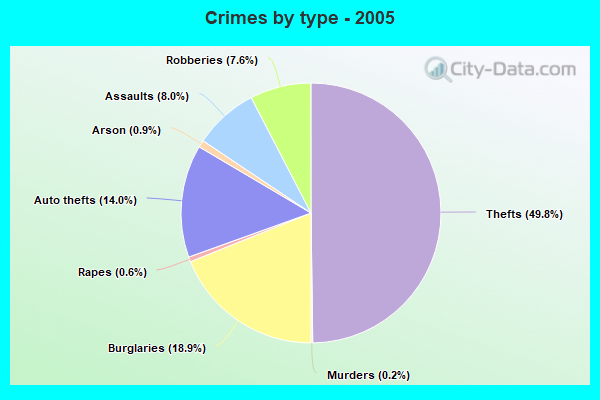
Violent crime rate in 2005
| Houston: | 535.5 |
| U.S. Average: | 227.0 |
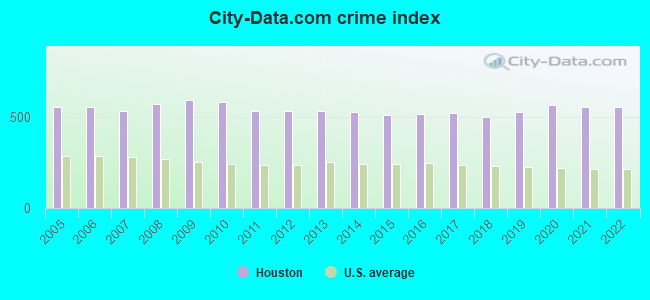
Property crime rate in 2022
| Houston: | 403.7 |
| U.S. Average: | 166.5 |
Property crime rate in 2021
| Houston: | 367.9 |
| U.S. Average: | 157.8 |
Property crime rate in 2020
| Houston: | 375.4 |
| U.S. Average: | 169.6 |
Property crime rate in 2019
| Houston: | 381.3 |
| U.S. Average: | 179.7 |
Property crime rate in 2018
| Houston: | 354.0 |
| U.S. Average: | 190.2 |
Property crime rate in 2017
| Houston: | 365.8 |
| U.S. Average: | 206.4 |
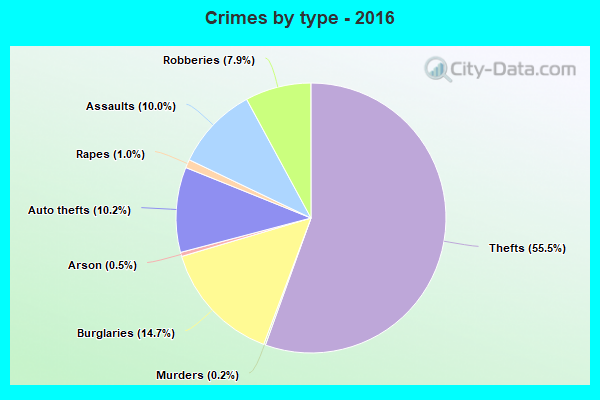
Property crime rate in 2016
| Houston: | 389.4 |
| U.S. Average: | 216.6 |
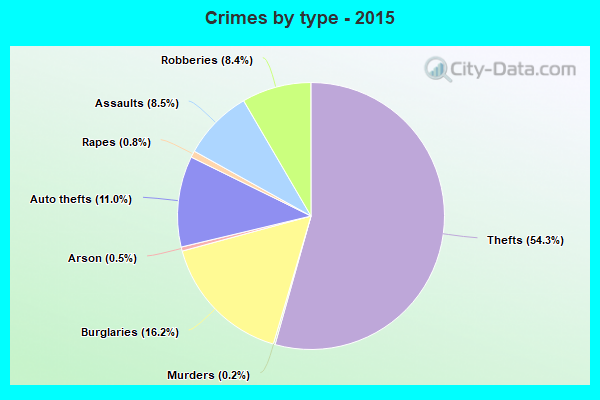
Property crime rate in 2015
| Houston: | 410.4 |
| U.S. Average: | 221.5 |
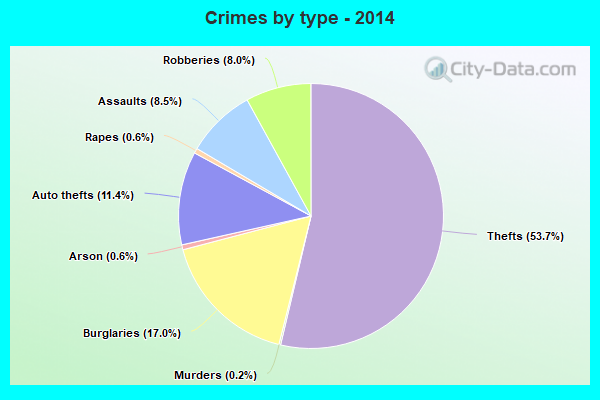
Property crime rate in 2014
| Houston: | 445.9 |
| U.S. Average: | 230.8 |
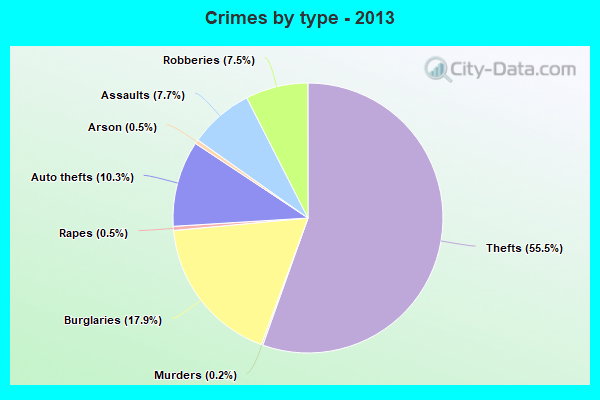
Property crime rate in 2013
| Houston: | 479.9 |
| U.S. Average: | 250.4 |
Property crime rate in 2012
| Houston: | 490.8 |
| U.S. Average: | 267.3 |
Property crime rate in 2011
| Houston: | 502.1 |
| U.S. Average: | 273.5 |
Property crime rate in 2010
| Houston: | 535.2 |
| U.S. Average: | 276.4 |
Property crime rate in 2009
| Houston: | 523.3 |
| U.S. Average: | 285.6 |
Property crime rate in 2008
| Houston: | 495.8 |
| U.S. Average: | 302.2 |
Property crime rate in 2007
| Houston: | 486.9 |
| U.S. Average: | 309.2 |
Property crime rate in 2006
| Houston: | 498.1 |
| U.S. Average: | 317.3 |
Property crime rate in 2005
| Houston: | 504.9 |
| U.S. Average: | 322.3 |


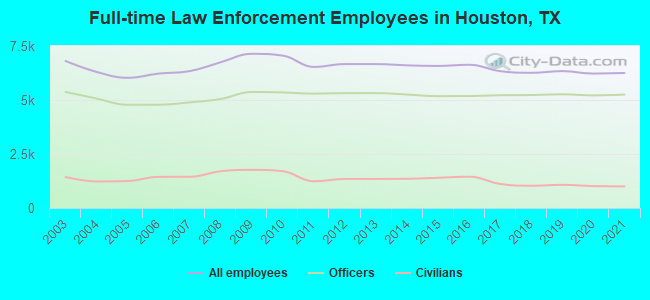
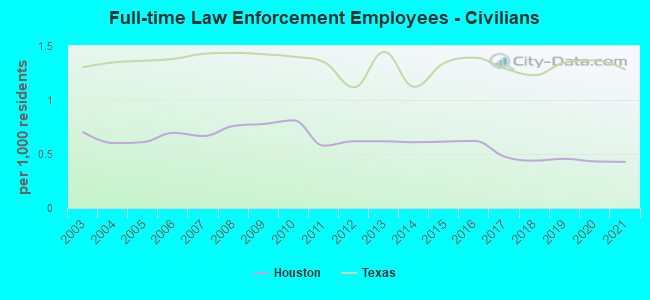
Full-time law enforcement employees in 2021, including police officers: 6,249 (5,250 officers - 4,345 male; 905 female).
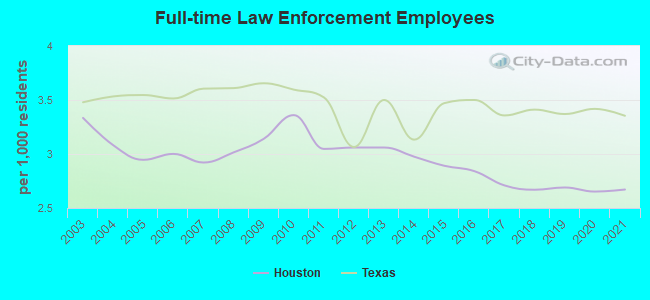
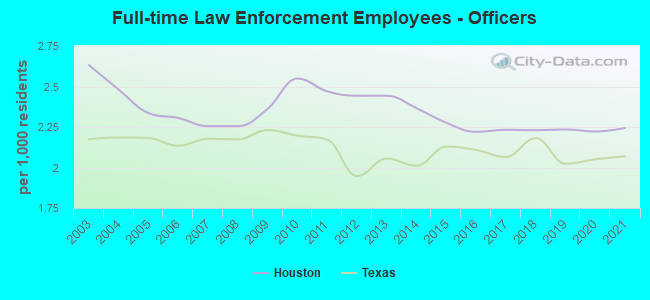
| Officers per 1,000 residents here: | 2.24 |
| Texas average: | 2.07 |
Full-time law enforcement employees in 2020, including police officers: 6,223 (5,212 officers - 4,313 male; 899 female).
| Officers per 1,000 residents here: | 2.22 |
| Texas average: | 2.05 |
Full-time law enforcement employees in 2019, including police officers: 6,337 (5,264 officers - 4,369 male; 895 female).
| Officers per 1,000 residents here: | 2.23 |
| Texas average: | 2.02 |
Full-time law enforcement employees in 2018, including police officers: 6,258 (5,229 officers - 4,365 male; 864 female).
| Officers per 1,000 residents here: | 2.23 |
| Texas average: | 2.18 |
Full-time law enforcement employees in 2017, including police officers: 6,334 (5,221 officers - 4,375 male; 846 female).
| Officers per 1,000 residents here: | 2.23 |
| Texas average: | 2.06 |
Full-time law enforcement employees in 2016, including police officers: 6,632 (5,182 officers - 4,356 male; 826 female).
| Officers per 1,000 residents here: | 2.22 |
| Texas average: | 2.11 |
Full-time law enforcement employees in 2015, including police officers: 6,577 (5,178 officers - 4,363 male; 815 female).
| Officers per 1,000 residents here: | 2.28 |
| Texas average: | 2.13 |
Full-time law enforcement employees in 2014, including police officers: 6,604 (5,252 officers - 4,445 male; 807 female).
| Officers per 1,000 residents here: | 2.37 |
| Texas average: | 2.01 |
Full-time law enforcement employees in 2012, including police officers: 6,663 (5,318 officers - 4,520 male; 798 female).
| Officers per 1,000 residents here: | 2.44 |
| Texas average: | 1.95 |
Full-time law enforcement employees in 2011, including police officers: 6,531 (5,294 officers - 4,523 male; 771 female).
| Officers per 1,000 residents here: | 2.47 |
| Texas average: | 2.17 |
Full-time law enforcement employees in 2010, including police officers: 7,054 (5,351 officers - 4,583 male; 768 female).
| Officers per 1,000 residents here: | 2.55 |
| Texas average: | 2.20 |
Full-time law enforcement employees in 2009, including police officers: 7,139 (5,371 officers - 4,618 male; 753 female).
| Officers per 1,000 residents here: | 2.36 |
| Texas average: | 2.23 |
Full-time law enforcement employees in 2008, including police officers: 6,750 (5,048 officers - 4,367 male; 681 female).
| Officers per 1,000 residents here: | 2.25 |
| Texas average: | 2.17 |
Full-time law enforcement employees in 2007, including police officers: 6,338 (4,892 officers - 4,236 male; 656 female).
| Officers per 1,000 residents here: | 2.25 |
| Texas average: | 2.18 |
Full-time law enforcement employees in 2006, including police officers: 6,223 (4,781 officers - 4,143 male; 638 female).
| Officers per 1,000 residents here: | 2.31 |
| Texas average: | 2.13 |
Full-time law enforcement employees in 2005, including police officers: 6,027 (4,779 officers - 4,161 male; 618 female).
| Officers per 1,000 residents here: | 2.34 |
| Texas average: | 2.18 |
Full-time law enforcement employees in 2004, including police officers: 6,298 (5,069 officers - 4,406 male; 663 female).
| Officers per 1,000 residents here: | 2.48 |
| Texas average: | 2.19 |
Full-time law enforcement employees in 2003, including police officers: 6,804 (5,372 officers - 4,676 male; 696 female).
| Officers per 1,000 residents here: | 2.63 |
| Texas average: | 2.17 |


Zip codes: 77002, 77003, 77004, 77005, 77006, 77007, 77008, 77009, 77010, 77011, 77012, 77013, 77014, 77016, 77017, 77018, 77019, 77020, 77021, 77022, 77023, 77025, 77026, 77027, 77028, 77030, 77031, 77033, 77034, 77035, 77036, 77038, 77040, 77041, 77042, 77043, 77045, 77046, 77047, 77048, 77050, 77051, 77053, 77054, 77056, 77057, 77058, 77059, 77061, 77062, 77063, 77064, 77065, 77066, 77067, 77068, 77069, 77070, 77071, 77072, 77073, 77074, 77075, 77076, 77077, 77078, 77079, 77080, 77081, 77082, 77084, 77085, 77086, 77087, 77088, 77090, 77091, 77092, 77093, 77094, 77095, 77096, 77098, 77099, 77201, 77336, 77339, 77345, 77357, 77365, 77373, 77375, 77377, 77379, 77386, 77388, 77407, 77429, 77433, 77447, 77449, 77478, 77484, 77489, 77493, 77504, 77506, 77587.