Crime rate in Coral Springs, Florida (FL): murders, rapes, robberies, assaults, burglaries, thefts, auto thefts, arson, law enforcement employees, police officers, crime map
Crime rate in Coral Springs, FL
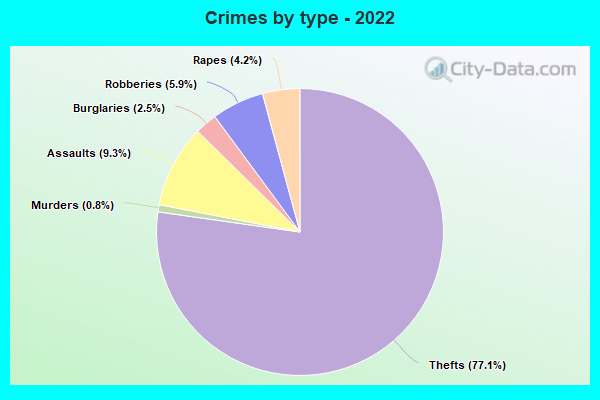
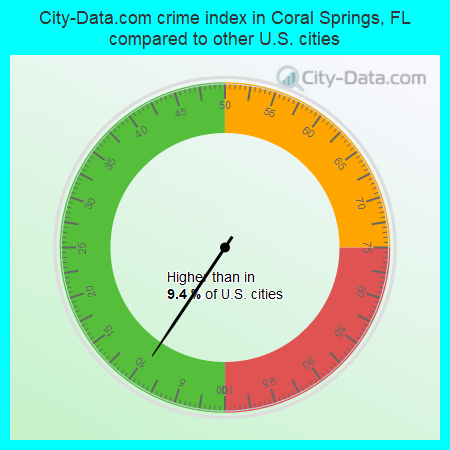
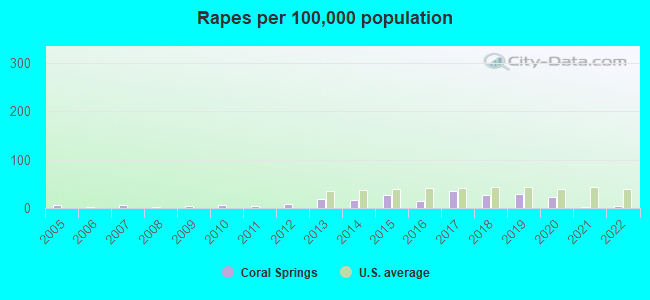
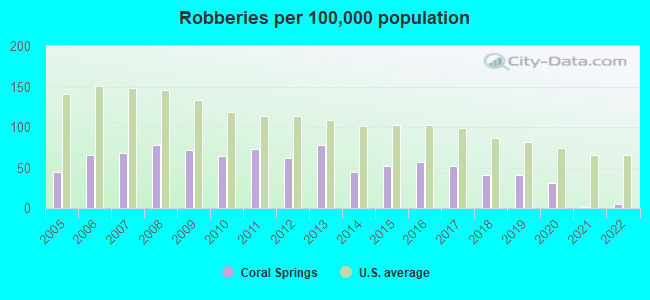
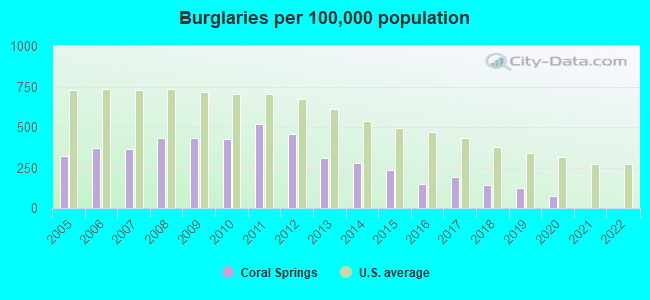
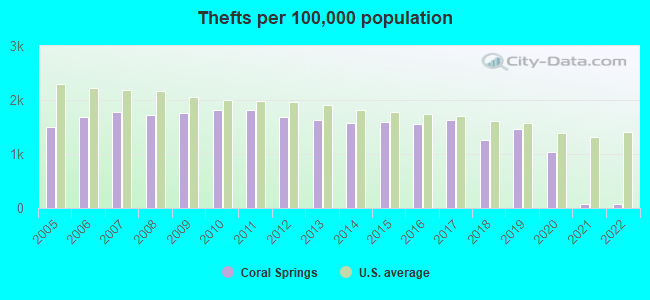
The 2022 crime rate in Coral Springs, FL is 11 (City-Data.com crime index), which is 22.9 times lower than the U.S. average. It was higher than in 9.4% U.S. cities. The 2022 Coral Springs crime rate rose by 78% compared to 2021. In the last 5 years Coral Springs has seen decline of violent crime and decline of property crime.See how dangerous Coral Springs, FL is compared to the nearest cities:
(Note: Higher means more crime)
(Note: Higher means more crime)
| Coral Springs: | 10.7 |
| Parkland: | 36.1 |
| Margate: | 100.2 |
| North Lauderdale: | 216.1 |
| Coconut Creek: | 90.8 |
| Tamarac: | 144.8 |
| Lauderhill: | 358.0 |
| Lauderdale Lakes: | 330.7 |
| Sunrise: | 131.4 |
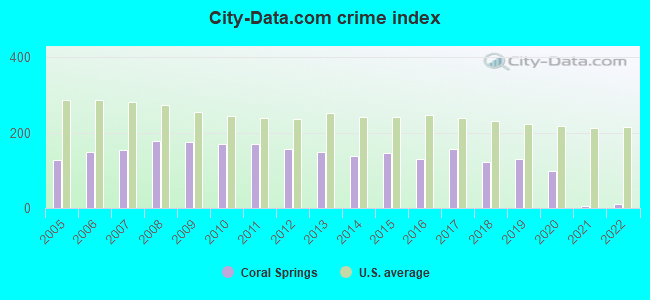
The City-Data.com crime index weighs serious crimes and violent crimes more heavily. Higher means more crime, U.S. average is 246.1. It adjusts for the number of visitors and daily workers commuting into cities.
- means the value is smaller than the state average.- means the value is about the same as the state average.
According to our research of Florida and other state lists, there were 22 registered sex offenders living in Coral Springs, Florida as of May 10, 2024.
The ratio of all residents to sex offenders in Coral Springs is 5,911 to 1.
The ratio of registered sex offenders to all residents in this city is much lower than the state average.
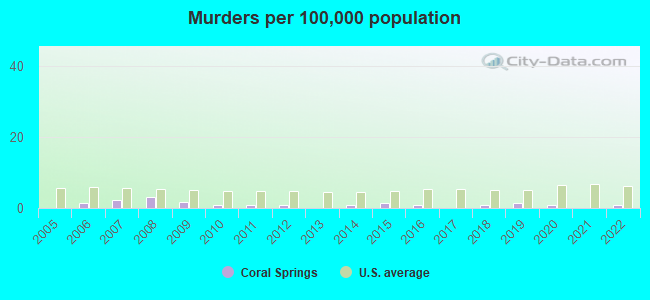
Violent crime rate in 2022
| Coral Springs: | 12.2 |
| U.S. Average: | 219.8 |
Violent crime rate in 2021
| Coral Springs: | 6.3 |
| U.S. Average: | 224.8 |
Violent crime rate in 2020
| Coral Springs: | 73.7 |
| U.S. Average: | 228.2 |
Violent crime rate in 2019
| Coral Springs: | 89.3 |
| U.S. Average: | 219.9 |
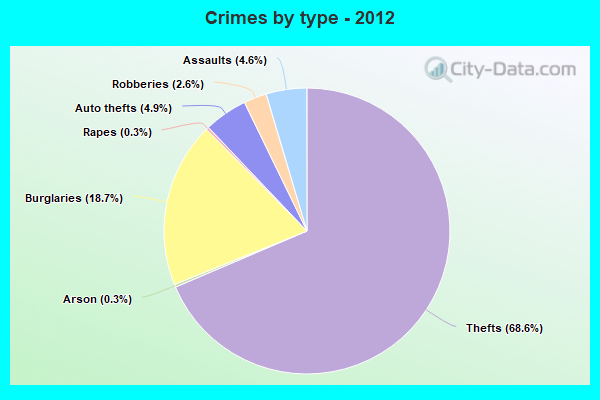
Violent crime rate in 2018
| Coral Springs: | 91.7 |
| U.S. Average: | 221.2 |
Violent crime rate in 2017
| Coral Springs: | 112.5 |
| U.S. Average: | 226.2 |
Violent crime rate in 2016
| Coral Springs: | 88.1 |
| U.S. Average: | 227.3 |
Violent crime rate in 2015
| Coral Springs: | 103.0 |
| U.S. Average: | 219.3 |
Violent crime rate in 2014
| Coral Springs: | 89.1 |
| U.S. Average: | 211.1 |
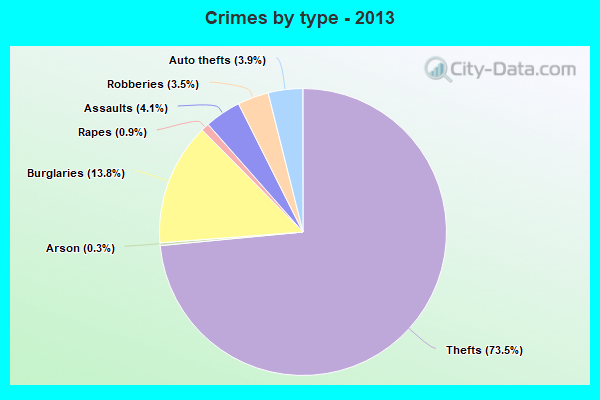
Violent crime rate in 2013
| Coral Springs: | 103.1 |
| U.S. Average: | 214.2 |
Violent crime rate in 2012
| Coral Springs: | 96.8 |
| U.S. Average: | 187.4 |
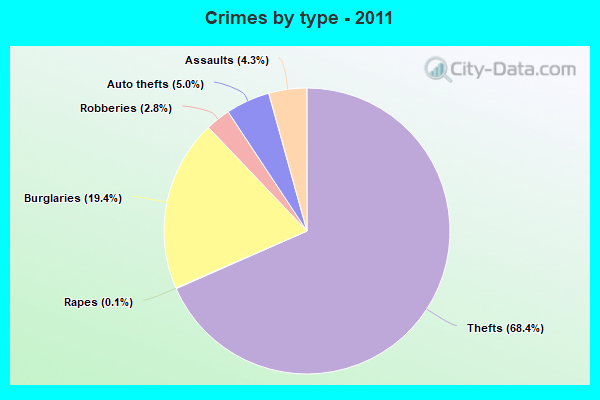
Violent crime rate in 2011
| Coral Springs: | 99.0 |
| U.S. Average: | 187.1 |
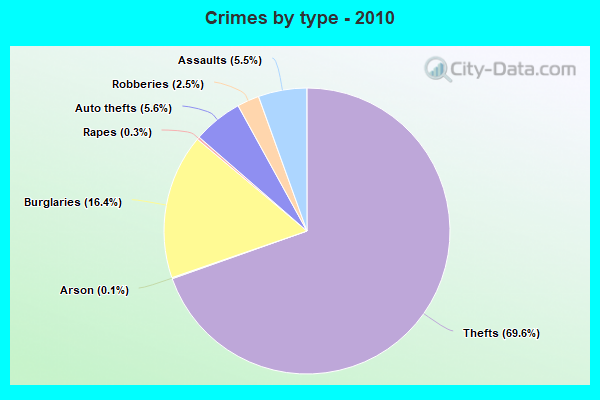
Violent crime rate in 2010
| Coral Springs: | 112.3 |
| U.S. Average: | 195.7 |
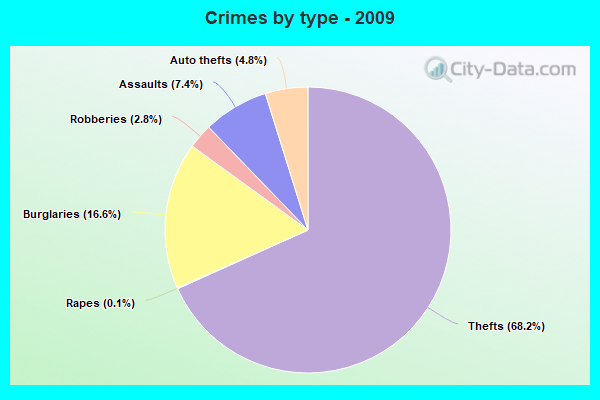
Violent crime rate in 2009
| Coral Springs: | 138.5 |
| U.S. Average: | 208.9 |
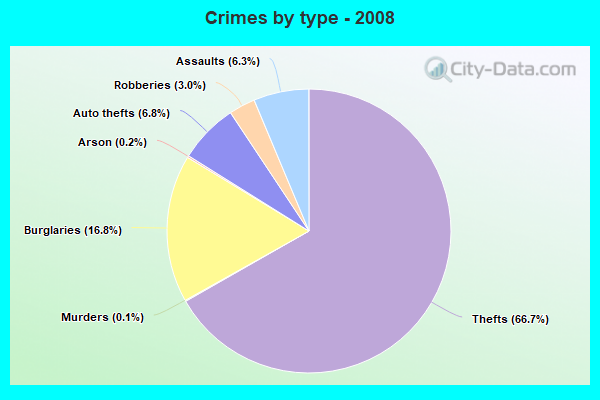
Violent crime rate in 2008
| Coral Springs: | 129.1 |
| U.S. Average: | 222.5 |
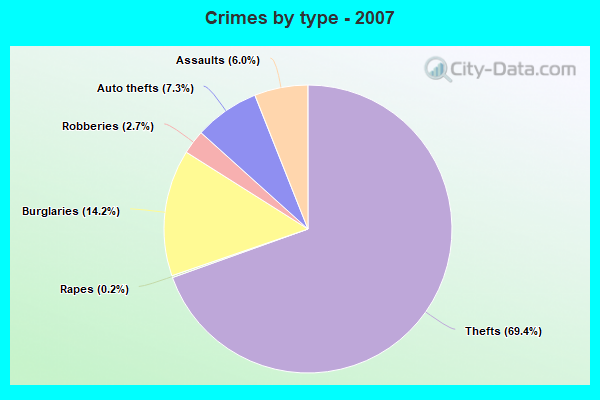
Violent crime rate in 2007
| Coral Springs: | 109.4 |
| U.S. Average: | 229.1 |
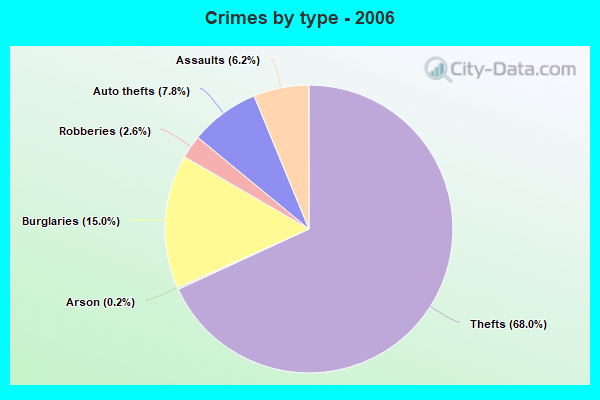
Violent crime rate in 2006
| Coral Springs: | 103.8 |
| U.S. Average: | 232.6 |
Violent crime rate in 2005
| Coral Springs: | 80.5 |
| U.S. Average: | 227.0 |
Property crime rate in 2022
| Coral Springs: | 3.9 |
| U.S. Average: | 166.5 |
Property crime rate in 2021
| Coral Springs: | 3.6 |
| U.S. Average: | 157.8 |
Property crime rate in 2020
| Coral Springs: | 84.5 |
| U.S. Average: | 169.6 |
Property crime rate in 2019
| Coral Springs: | 116.2 |
| U.S. Average: | 179.7 |
Property crime rate in 2018
| Coral Springs: | 108.0 |
| U.S. Average: | 190.2 |
Property crime rate in 2017
| Coral Springs: | 143.6 |
| U.S. Average: | 206.4 |
Property crime rate in 2016
| Coral Springs: | 128.2 |
| U.S. Average: | 216.6 |
Property crime rate in 2015
| Coral Springs: | 140.0 |
| U.S. Average: | 221.5 |
Property crime rate in 2014
| Coral Springs: | 147.2 |
| U.S. Average: | 230.8 |
Property crime rate in 2013
| Coral Springs: | 156.0 |
| U.S. Average: | 250.4 |
Property crime rate in 2012
| Coral Springs: | 193.4 |
| U.S. Average: | 267.3 |
Property crime rate in 2011
| Coral Springs: | 214.3 |
| U.S. Average: | 273.5 |
Property crime rate in 2010
| Coral Springs: | 197.6 |
| U.S. Average: | 276.4 |
Property crime rate in 2009
| Coral Springs: | 193.0 |
| U.S. Average: | 285.6 |
Property crime rate in 2008
| Coral Springs: | 199.8 |
| U.S. Average: | 302.2 |
Property crime rate in 2007
| Coral Springs: | 171.7 |
| U.S. Average: | 309.2 |
Property crime rate in 2006
| Coral Springs: | 170.2 |
| U.S. Average: | 317.3 |
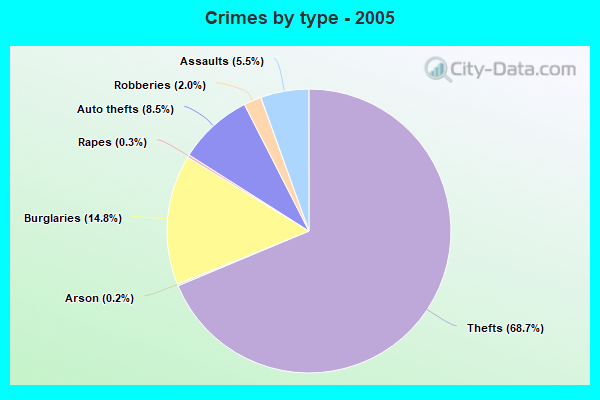
Property crime rate in 2005
| Coral Springs: | 152.0 |
| U.S. Average: | 322.3 |

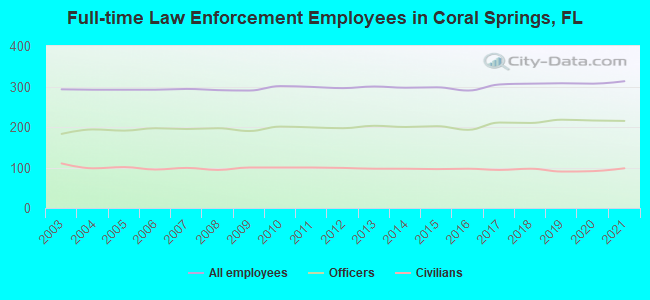
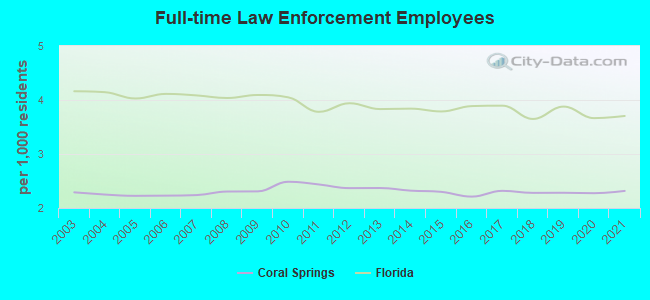
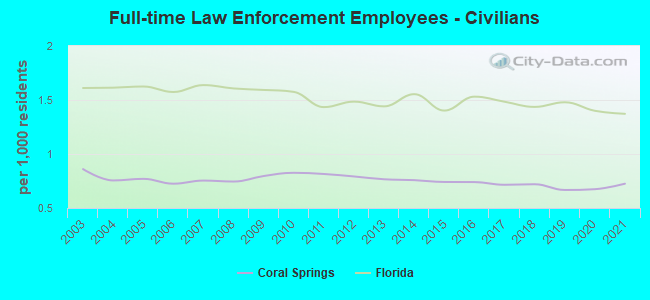
Full-time law enforcement employees in 2021, including police officers: 313 (215 officers - 180 male; 35 female).
| Officers per 1,000 residents here: | 1.59 |
| Florida average: | 2.33 |
Full-time law enforcement employees in 2020, including police officers: 307 (216 officers - 181 male; 35 female).
| Officers per 1,000 residents here: | 1.60 |
| Florida average: | 2.26 |
Full-time law enforcement employees in 2019, including police officers: 308 (218 officers - 182 male; 36 female).
| Officers per 1,000 residents here: | 1.62 |
| Florida average: | 2.40 |
Full-time law enforcement employees in 2018, including police officers: 307 (210 officers - 174 male; 36 female).
| Officers per 1,000 residents here: | 1.56 |
| Florida average: | 2.21 |
Full-time law enforcement employees in 2017, including police officers: 305 (211 officers - 174 male; 37 female).
| Officers per 1,000 residents here: | 1.60 |
| Florida average: | 2.41 |
Full-time law enforcement employees in 2016, including police officers: 290 (193 officers - 167 male; 26 female).
| Officers per 1,000 residents here: | 1.47 |
| Florida average: | 2.36 |
Full-time law enforcement employees in 2015, including police officers: 298 (202 officers - 172 male; 30 female).
| Officers per 1,000 residents here: | 1.56 |
| Florida average: | 2.39 |
Full-time law enforcement employees in 2014, including police officers: 297 (200 officers - 170 male; 30 female).
| Officers per 1,000 residents here: | 1.56 |
| Florida average: | 2.29 |
Full-time law enforcement employees in 2013, including police officers: 300 (203 officers - 170 male; 33 female).
| Officers per 1,000 residents here: | 1.60 |
| Florida average: | 2.39 |
Full-time law enforcement employees in 2012, including police officers: 296 (197 officers - 165 male; 32 female).
| Officers per 1,000 residents here: | 1.58 |
| Florida average: | 2.45 |
Full-time law enforcement employees in 2011, including police officers: 299 (199 officers - 164 male; 35 female).
| Officers per 1,000 residents here: | 1.62 |
| Florida average: | 2.35 |
Full-time law enforcement employees in 2010, including police officers: 301 (201 officers - 165 male; 36 female).
| Officers per 1,000 residents here: | 1.66 |
| Florida average: | 2.47 |
Full-time law enforcement employees in 2009, including police officers: 290 (190 officers - 158 male; 32 female).
| Officers per 1,000 residents here: | 1.51 |
| Florida average: | 2.50 |
Full-time law enforcement employees in 2008, including police officers: 291 (197 officers - 163 male; 34 female).
| Officers per 1,000 residents here: | 1.56 |
| Florida average: | 2.43 |
Full-time law enforcement employees in 2007, including police officers: 294 (195 officers - 164 male; 31 female).
| Officers per 1,000 residents here: | 1.49 |
| Florida average: | 2.45 |
Full-time law enforcement employees in 2006, including police officers: 292 (197 officers - 169 male; 28 female).
| Officers per 1,000 residents here: | 1.50 |
| Florida average: | 2.54 |
Full-time law enforcement employees in 2005, including police officers: 292 (191 officers - 168 male; 23 female).
| Officers per 1,000 residents here: | 1.46 |
| Florida average: | 2.40 |
Full-time law enforcement employees in 2004, including police officers: 292 (194 officers - 171 male; 23 female).
| Officers per 1,000 residents here: | 1.49 |
| Florida average: | 2.53 |
Full-time law enforcement employees in 2003, including police officers: 293 (183 officers - 161 male; 22 female).
| Officers per 1,000 residents here: | 1.43 |
| Florida average: | 2.55 |