Crime rate in Colorado Springs, Colorado (CO): murders, rapes, robberies, assaults, burglaries, thefts, auto thefts, arson, law enforcement employees, police officers, crime map
Crime rate in Colorado Springs, CO
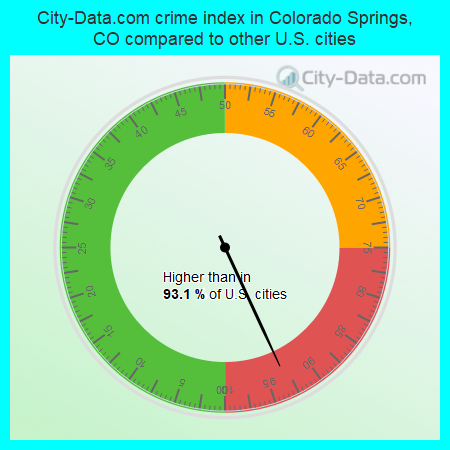
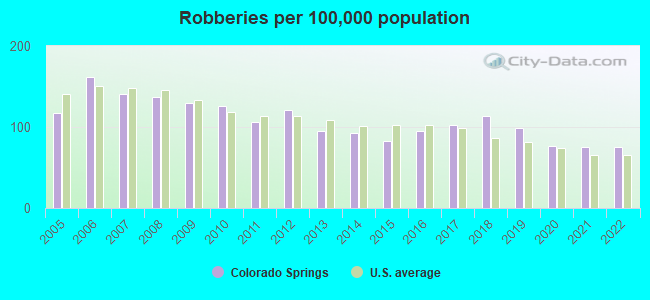
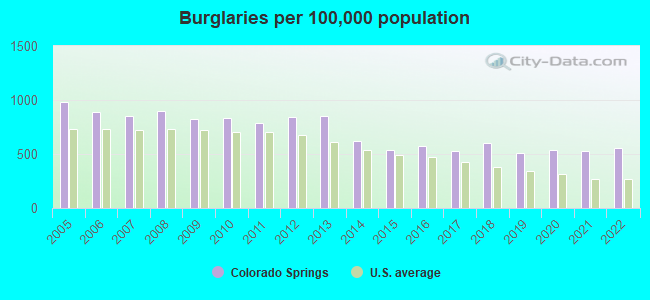
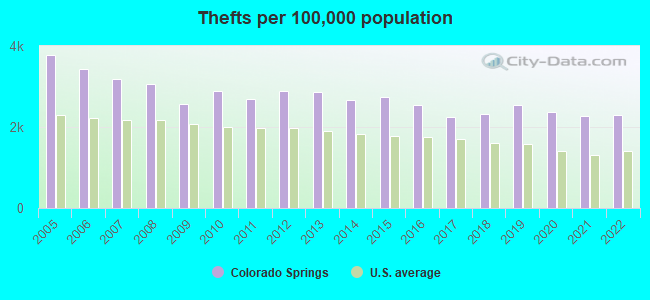
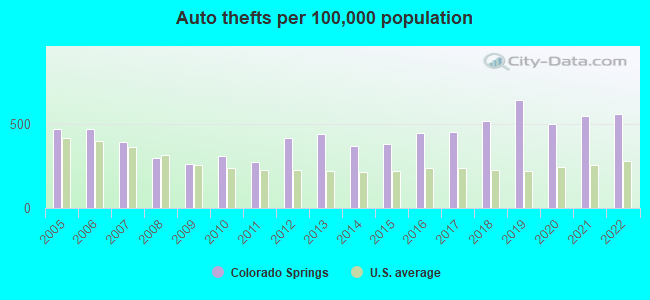
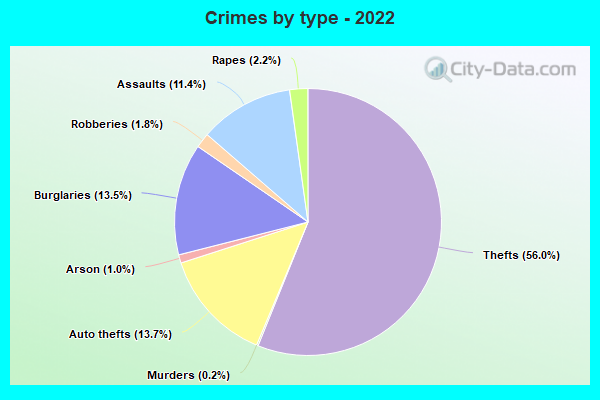
The 2022 crime rate in Colorado Springs, CO is 382 (City-Data.com crime index), which is 1.6 times greater than the U.S. average. It was higher than in 93.1% U.S. cities. The 2022 Colorado Springs crime rate rose by 3% compared to 2021. The number of homicides stood at 45 - an increase of 8 compared to 2021. In the last 5 years Colorado Springs has seen increasing violent crime and decreasing property crime.See how dangerous Colorado Springs, CO is compared to the nearest cities:
(Note: Higher means more crime)
(Note: Higher means more crime)
| Colorado Springs: | 382.5 |
| Manitou Springs: | 196.6 |
| Fountain: | 231.0 |
| Green Mountain Falls: | 49.1 |
| Monument: | 196.1 |
| Woodland Park: | 128.7 |
| Palmer Lake: | 71.7 |
| Cripple Creek: | 233.0 |
| Calhan: | 61.3 |
The City-Data.com crime index weighs serious crimes and violent crimes more heavily. Higher means more crime, U.S. average is 246.1. It adjusts for the number of visitors and daily workers commuting into cities.
- means the value is smaller than the state average.- means the value is about the same as the state average.
- means the value is bigger than the state average.
- means the value is much bigger than the state average.
According to our research of Colorado and other state lists, there were 1,681 registered sex offenders living in Colorado Springs, Colorado as of May 16, 2024.
The ratio of all residents to sex offenders in Colorado Springs is 277 to 1.
Violent crime rate in 2022
| Colorado Springs: | 381.0 |
| U.S. Average: | 219.8 |
Violent crime rate in 2021
| Colorado Springs: | 360.0 |
| U.S. Average: | 224.8 |
Violent crime rate in 2020
| Colorado Springs: | 370.2 |
| U.S. Average: | 228.2 |
Violent crime rate in 2019
| Colorado Springs: | 359.3 |
| U.S. Average: | 219.9 |
Violent crime rate in 2018
| Colorado Springs: | 373.0 |
| U.S. Average: | 221.2 |
Violent crime rate in 2017
| Colorado Springs: | 336.2 |
| U.S. Average: | 226.2 |
Violent crime rate in 2016
| Colorado Springs: | 303.7 |
| U.S. Average: | 227.3 |
Violent crime rate in 2015
| Colorado Springs: | 263.8 |
| U.S. Average: | 219.3 |
Violent crime rate in 2014
| Colorado Springs: | 279.5 |
| U.S. Average: | 211.1 |
Violent crime rate in 2013
| Colorado Springs: | 266.0 |
| U.S. Average: | 214.2 |
Violent crime rate in 2012
| Colorado Springs: | 274.9 |
| U.S. Average: | 187.4 |
Violent crime rate in 2011
| Colorado Springs: | 267.8 |
| U.S. Average: | 187.1 |
Violent crime rate in 2010
| Colorado Springs: | 281.4 |
| U.S. Average: | 195.7 |
Violent crime rate in 2009
| Colorado Springs: | 293.7 |
| U.S. Average: | 208.9 |
Violent crime rate in 2008
| Colorado Springs: | 316.5 |
| U.S. Average: | 222.5 |
Violent crime rate in 2007
| Colorado Springs: | 262.7 |
| U.S. Average: | 229.1 |
Violent crime rate in 2006
| Colorado Springs: | 270.3 |
| U.S. Average: | 232.6 |
Violent crime rate in 2005
| Colorado Springs: | 231.2 |
| U.S. Average: | 227.0 |
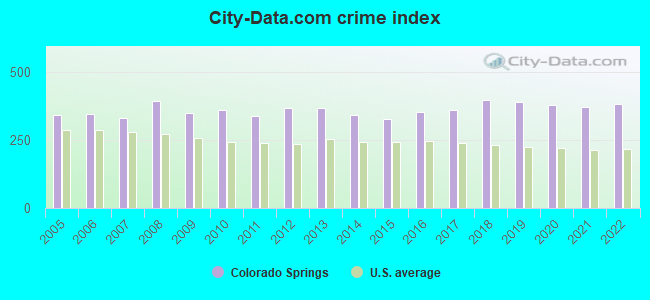
Property crime rate in 2022
| Colorado Springs: | 308.6 |
| U.S. Average: | 166.5 |
Property crime rate in 2021
| Colorado Springs: | 301.5 |
| U.S. Average: | 157.8 |
Property crime rate in 2020
| Colorado Springs: | 301.7 |
| U.S. Average: | 169.6 |
Property crime rate in 2019
| Colorado Springs: | 324.9 |
| U.S. Average: | 179.7 |
Property crime rate in 2018
| Colorado Springs: | 314.5 |
| U.S. Average: | 190.2 |
Property crime rate in 2017
| Colorado Springs: | 285.7 |
| U.S. Average: | 206.4 |
Property crime rate in 2016
| Colorado Springs: | 309.0 |
| U.S. Average: | 216.6 |
Property crime rate in 2015
| Colorado Springs: | 300.6 |
| U.S. Average: | 221.5 |
Property crime rate in 2014
| Colorado Springs: | 313.3 |
| U.S. Average: | 230.8 |
Property crime rate in 2013
| Colorado Springs: | 381.0 |
| U.S. Average: | 250.4 |
Property crime rate in 2012
| Colorado Springs: | 374.8 |
| U.S. Average: | 267.3 |
Property crime rate in 2011
| Colorado Springs: | 332.7 |
| U.S. Average: | 273.5 |
Property crime rate in 2010
| Colorado Springs: | 356.9 |
| U.S. Average: | 276.4 |
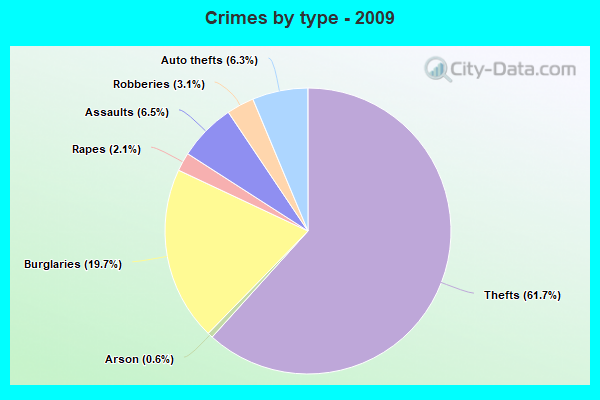
Property crime rate in 2009
| Colorado Springs: | 332.9 |
| U.S. Average: | 285.6 |
Property crime rate in 2008
| Colorado Springs: | 376.8 |
| U.S. Average: | 302.2 |
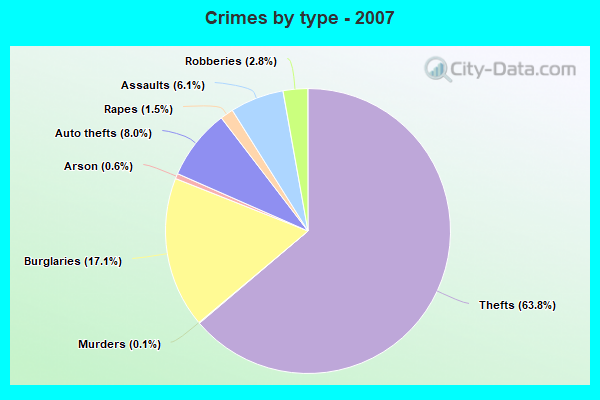
Property crime rate in 2007
| Colorado Springs: | 324.5 |
| U.S. Average: | 309.2 |
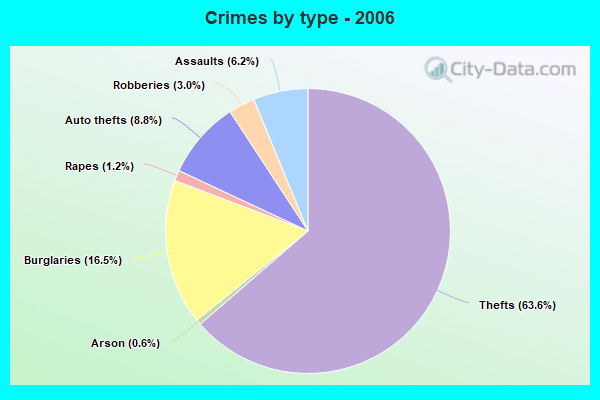
Property crime rate in 2006
| Colorado Springs: | 351.3 |
| U.S. Average: | 317.3 |
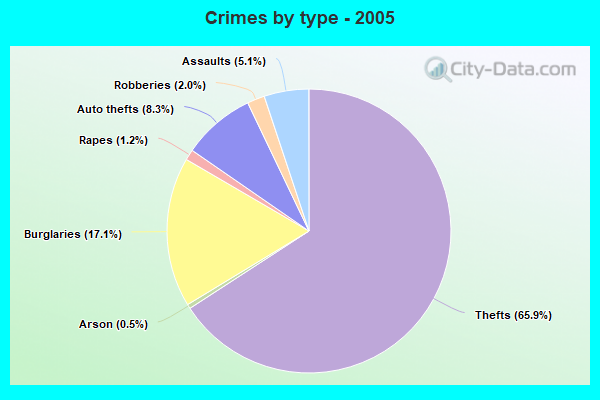
Property crime rate in 2005
| Colorado Springs: | 381.0 |
| U.S. Average: | 322.3 |


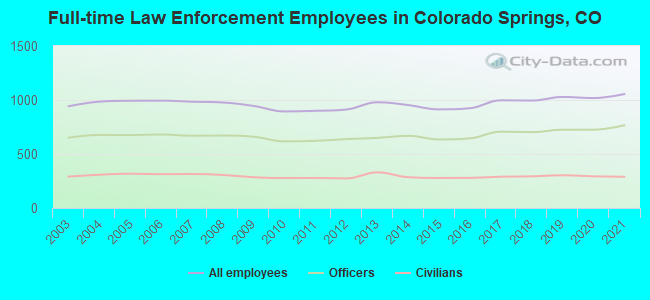
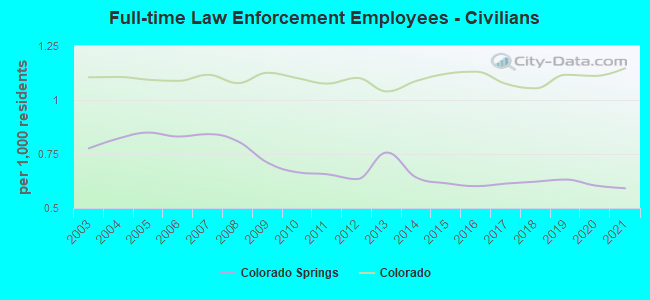
Full-time law enforcement employees in 2021, including police officers: 1,055 (766 officers - 638 male; 128 female).
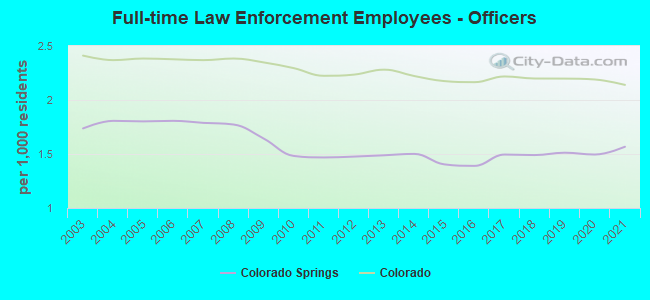
| Officers per 1,000 residents here: | 1.57 |
| Colorado average: | 2.14 |
Full-time law enforcement employees in 2020, including police officers: 1,018 (725 officers - 612 male; 113 female).
| Officers per 1,000 residents here: | 1.49 |
| Colorado average: | 2.19 |
Full-time law enforcement employees in 2019, including police officers: 1,028 (725 officers - 602 male; 123 female).
| Officers per 1,000 residents here: | 1.51 |
| Colorado average: | 2.20 |
Full-time law enforcement employees in 2018, including police officers: 995 (702 officers - 598 male; 104 female).
| Officers per 1,000 residents here: | 1.49 |
| Colorado average: | 2.20 |
Full-time law enforcement employees in 2017, including police officers: 997 (707 officers - 607 male; 100 female).
| Officers per 1,000 residents here: | 1.49 |
| Colorado average: | 2.22 |
Full-time law enforcement employees in 2016, including police officers: 924 (645 officers - 557 male; 88 female).
| Officers per 1,000 residents here: | 1.39 |
| Colorado average: | 2.17 |
Full-time law enforcement employees in 2015, including police officers: 913 (635 officers - 549 male; 86 female).
| Officers per 1,000 residents here: | 1.40 |
| Colorado average: | 2.18 |
Full-time law enforcement employees in 2014, including police officers: 953 (668 officers - 582 male; 86 female).
| Officers per 1,000 residents here: | 1.50 |
| Colorado average: | 2.22 |
Full-time law enforcement employees in 2013, including police officers: 979 (649 officers - 567 male; 82 female).
| Officers per 1,000 residents here: | 1.49 |
| Colorado average: | 2.28 |
Full-time law enforcement employees in 2012, including police officers: 912 (638 officers - 558 male; 80 female).
| Officers per 1,000 residents here: | 1.48 |
| Colorado average: | 2.23 |
Full-time law enforcement employees in 2011, including police officers: 900 (622 officers - 541 male; 81 female).
| Officers per 1,000 residents here: | 1.47 |
| Colorado average: | 2.22 |
Full-time law enforcement employees in 2010, including police officers: 894 (617 officers - 535 male; 82 female).
| Officers per 1,000 residents here: | 1.48 |
| Colorado average: | 2.30 |
Full-time law enforcement employees in 2009, including police officers: 945 (660 officers - 573 male; 87 female).
| Officers per 1,000 residents here: | 1.64 |
| Colorado average: | 2.35 |
Full-time law enforcement employees in 2008, including police officers: 977 (671 officers - 584 male; 87 female).
| Officers per 1,000 residents here: | 1.77 |
| Colorado average: | 2.38 |
Full-time law enforcement employees in 2007, including police officers: 984 (669 officers - 583 male; 86 female).
| Officers per 1,000 residents here: | 1.79 |
| Colorado average: | 2.37 |
Full-time law enforcement employees in 2006, including police officers: 994 (681 officers - 591 male; 90 female).
| Officers per 1,000 residents here: | 1.81 |
| Colorado average: | 2.38 |
Full-time law enforcement employees in 2005, including police officers: 993 (675 officers - 587 male; 88 female).
| Officers per 1,000 residents here: | 1.80 |
| Colorado average: | 2.38 |
Full-time law enforcement employees in 2004, including police officers: 985 (677 officers - 591 male; 86 female).
| Officers per 1,000 residents here: | 1.81 |
| Colorado average: | 2.37 |
Full-time law enforcement employees in 2003, including police officers: 942 (651 officers - 571 male; 80 female).
| Officers per 1,000 residents here: | 1.74 |
| Colorado average: | 2.41 |


Zip codes: 80829, 80831, 80903, 80904, 80905, 80906, 80907, 80909, 80910, 80911, 80914, 80917, 80918, 80919, 80920, 80923, 80924, 80925, 80926, 80927, 80951.