Crime rate in Anaheim, California (CA): murders, rapes, robberies, assaults, burglaries, thefts, auto thefts, arson, law enforcement employees, police officers, crime map
Crime rate in Anaheim, CA
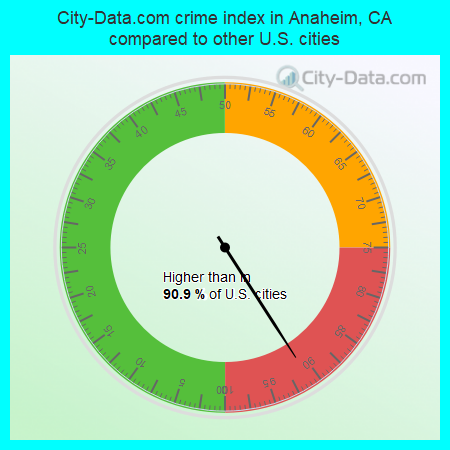
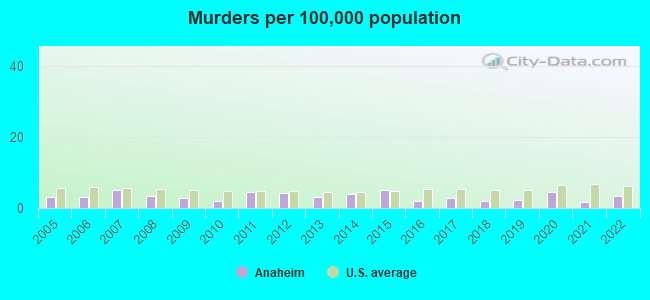
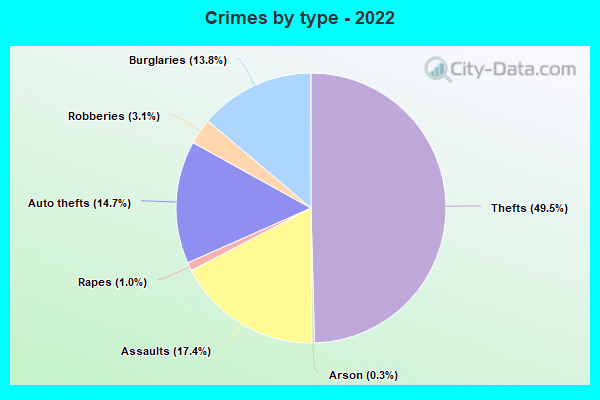
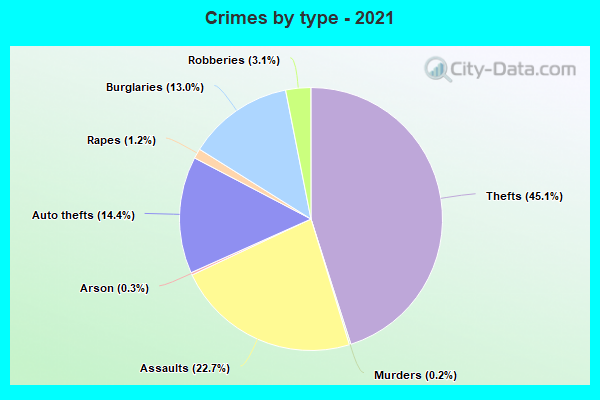
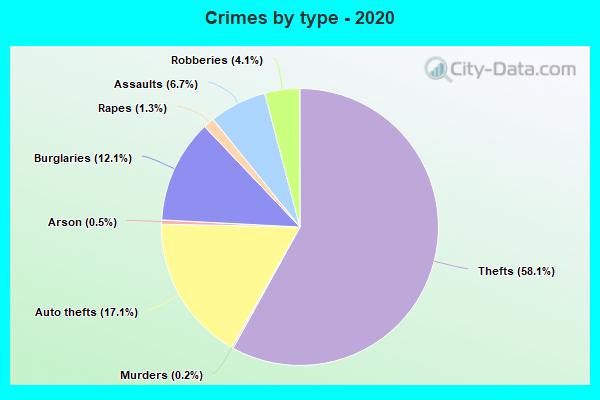
The 2022 crime rate in Anaheim, CA is 339 (City-Data.com crime index), which is 1.4 times greater than the U.S. average. It was higher than in 90.9% U.S. cities. The 2022 Anaheim crime rate rose by 240% compared to 2021. The number of homicides stood at 12 - an increase of 6 compared to 2021. In the last 5 years Anaheim has seen increasing violent crime and rise of property crime.See how dangerous Anaheim, CA is compared to the nearest cities:
(Note: Higher means more crime)
(Note: Higher means more crime)
| Anaheim: | 338.6 |
| Placentia: | 150.9 |
| Fullerton: | 262.7 |
| Orange: | 124.8 |
| Villa Park: | 54.3 |
| Garden Grove: | 207.0 |
| Brea: | 206.7 |
| Stanton: | 219.8 |
| Santa Ana: | 115.0 |
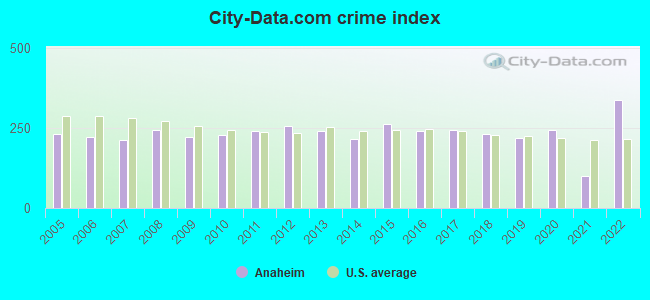
The City-Data.com crime index weighs serious crimes and violent crimes more heavily. Higher means more crime, U.S. average is 246.1. It adjusts for the number of visitors and daily workers commuting into cities.
- means the value is smaller than the state average.- means the value is about the same as the state average.
- means the value is bigger than the state average.
- means the value is much bigger than the state average.
According to our research of California and other state lists, there were 329 registered sex offenders living in Anaheim, California as of May 17, 2024.
The ratio of all residents to sex offenders in Anaheim is 1,067 to 1.
The ratio of registered sex offenders to all residents in this city is lower than the state average.
Violent crime rate in 2022
| Anaheim: | 406.3 |
| U.S. Average: | 219.8 |
Violent crime rate in 2021
| Anaheim: | 135.4 |
| U.S. Average: | 224.8 |
Violent crime rate in 2020
| Anaheim: | 202.0 |
| U.S. Average: | 228.2 |
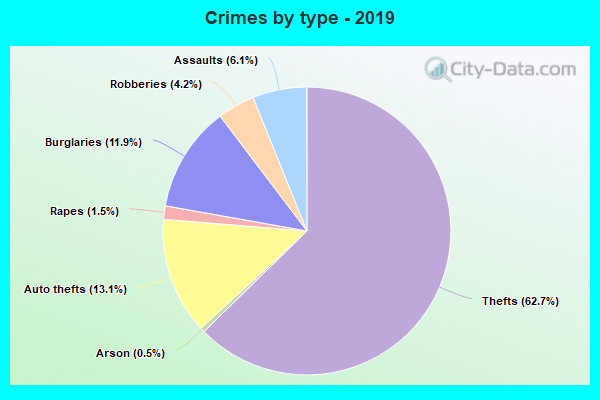
Violent crime rate in 2019
| Anaheim: | 181.5 |
| U.S. Average: | 219.9 |
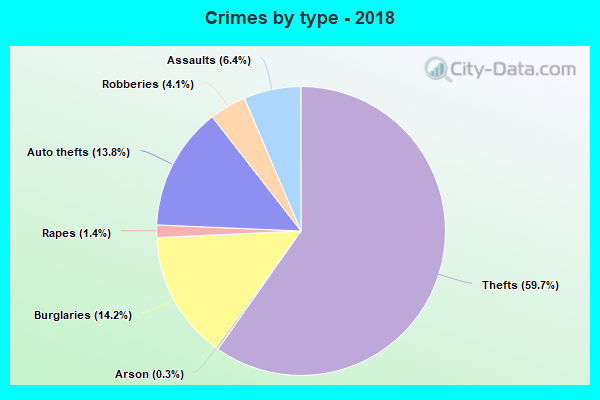
Violent crime rate in 2018
| Anaheim: | 191.0 |
| U.S. Average: | 221.2 |
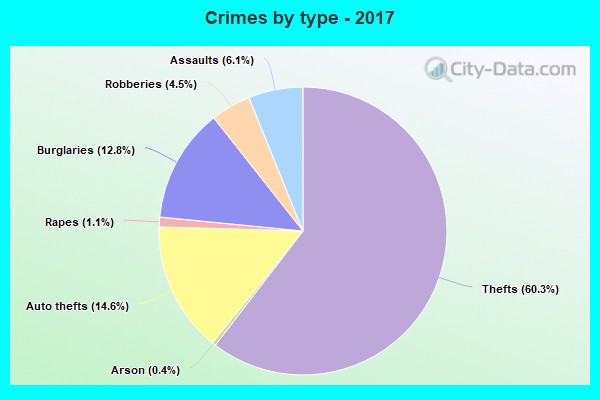
Violent crime rate in 2017
| Anaheim: | 197.8 |
| U.S. Average: | 226.2 |
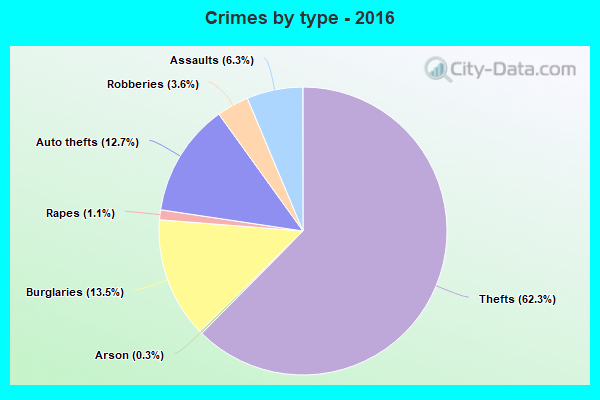
Violent crime rate in 2016
| Anaheim: | 191.4 |
| U.S. Average: | 227.3 |
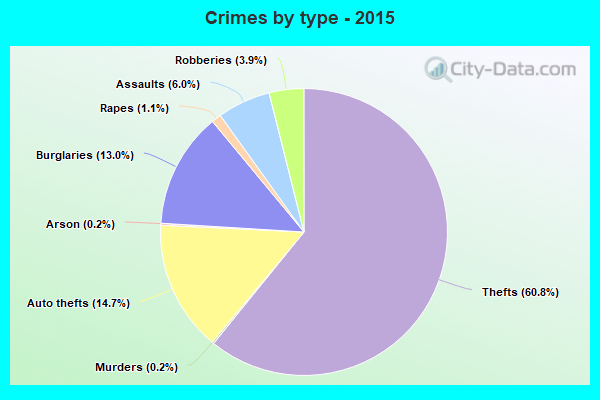
Violent crime rate in 2015
| Anaheim: | 208.0 |
| U.S. Average: | 219.3 |
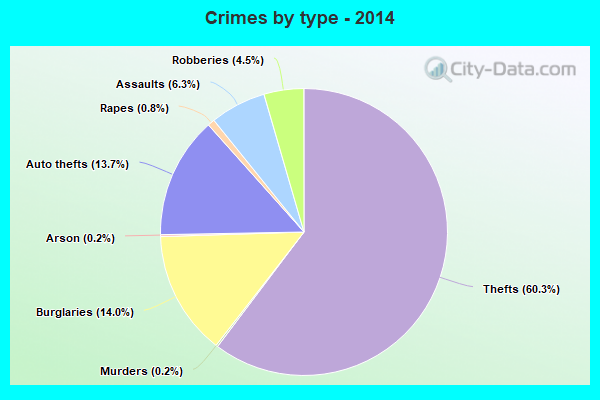
Violent crime rate in 2014
| Anaheim: | 176.1 |
| U.S. Average: | 211.1 |
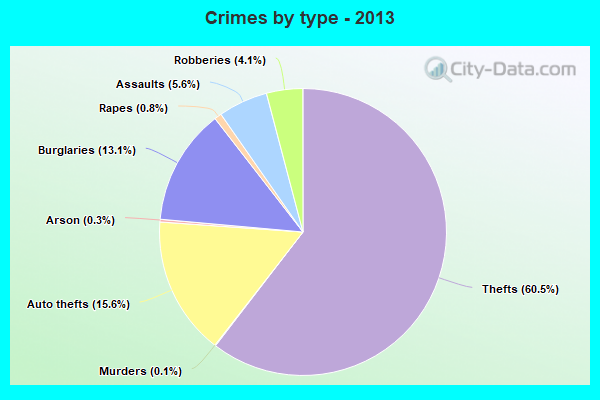
Violent crime rate in 2013
| Anaheim: | 180.3 |
| U.S. Average: | 214.2 |
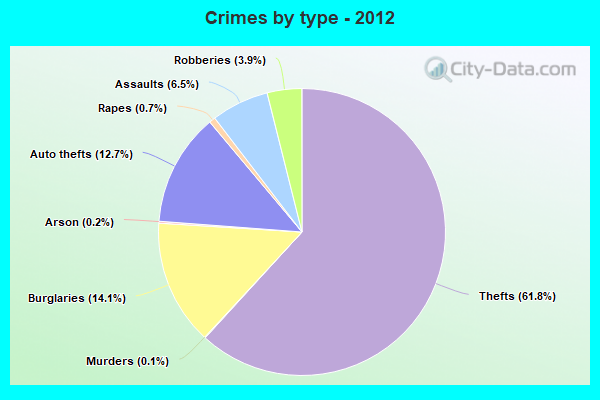
Violent crime rate in 2012
| Anaheim: | 204.0 |
| U.S. Average: | 187.4 |
Violent crime rate in 2011
| Anaheim: | 210.3 |
| U.S. Average: | 187.1 |
Violent crime rate in 2010
| Anaheim: | 188.8 |
| U.S. Average: | 195.7 |
Violent crime rate in 2009
| Anaheim: | 190.9 |
| U.S. Average: | 208.9 |
Violent crime rate in 2008
| Anaheim: | 213.9 |
| U.S. Average: | 222.5 |
Violent crime rate in 2007
| Anaheim: | 188.5 |
| U.S. Average: | 229.1 |
Violent crime rate in 2006
| Anaheim: | 199.6 |
| U.S. Average: | 232.6 |
Violent crime rate in 2005
| Anaheim: | 206.8 |
| U.S. Average: | 227.0 |
Property crime rate in 2022
| Anaheim: | 264.3 |
| U.S. Average: | 166.5 |
Property crime rate in 2021
| Anaheim: | 65.7 |
| U.S. Average: | 157.8 |
Property crime rate in 2020
| Anaheim: | 227.8 |
| U.S. Average: | 169.6 |
Property crime rate in 2019
| Anaheim: | 199.0 |
| U.S. Average: | 179.7 |
Property crime rate in 2018
| Anaheim: | 220.9 |
| U.S. Average: | 190.2 |
Property crime rate in 2017
| Anaheim: | 232.8 |
| U.S. Average: | 206.4 |
Property crime rate in 2016
| Anaheim: | 237.5 |
| U.S. Average: | 216.6 |
Property crime rate in 2015
| Anaheim: | 254.7 |
| U.S. Average: | 221.5 |
Property crime rate in 2014
| Anaheim: | 211.1 |
| U.S. Average: | 230.8 |
Property crime rate in 2013
| Anaheim: | 249.2 |
| U.S. Average: | 250.4 |
Property crime rate in 2012
| Anaheim: | 257.8 |
| U.S. Average: | 267.3 |
Property crime rate in 2011
| Anaheim: | 219.9 |
| U.S. Average: | 273.5 |
Property crime rate in 2010
| Anaheim: | 227.1 |
| U.S. Average: | 276.4 |
Property crime rate in 2009
| Anaheim: | 212.1 |
| U.S. Average: | 285.6 |
Property crime rate in 2008
| Anaheim: | 229.7 |
| U.S. Average: | 302.2 |
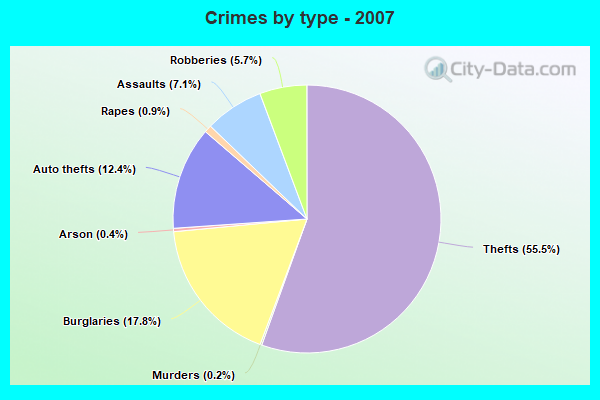
Property crime rate in 2007
| Anaheim: | 202.1 |
| U.S. Average: | 309.2 |
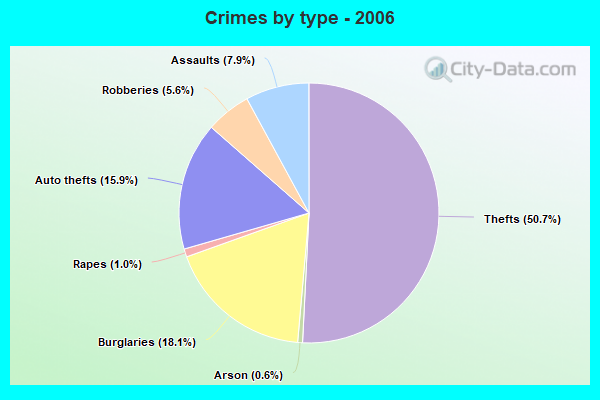
Property crime rate in 2006
| Anaheim: | 213.7 |
| U.S. Average: | 317.3 |
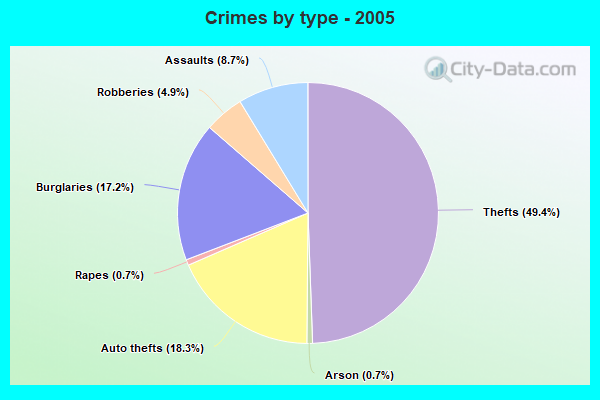
Property crime rate in 2005
| Anaheim: | 232.2 |
| U.S. Average: | 322.3 |

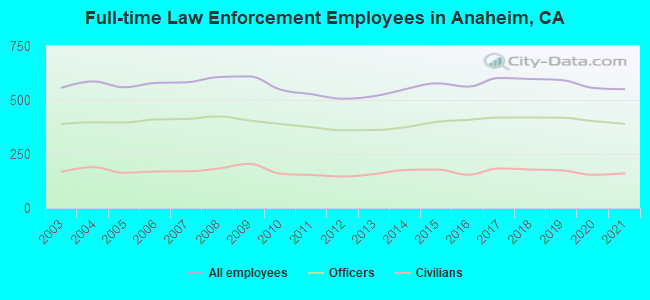
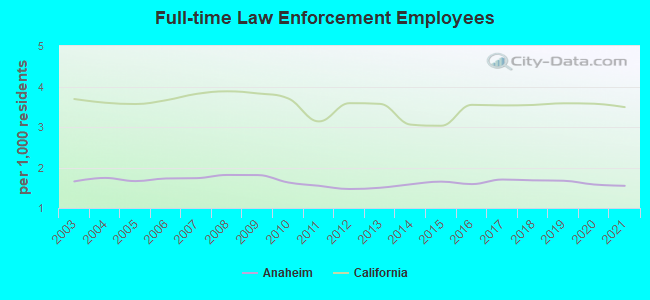
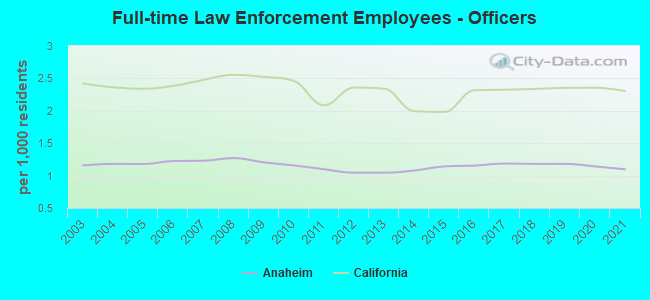
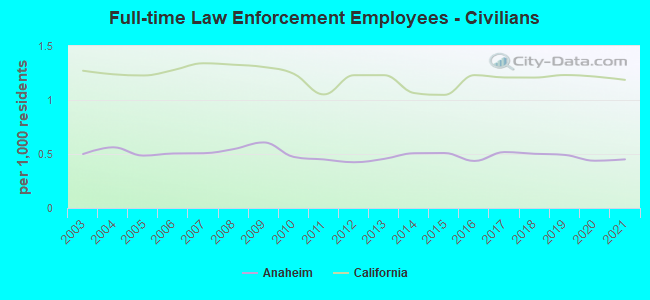
Full-time law enforcement employees in 2021, including police officers: 550 (390 officers - 355 male; 35 female).
| Officers per 1,000 residents here: | 1.10 |
| California average: | 2.30 |
Full-time law enforcement employees in 2020, including police officers: 556 (402 officers - 367 male; 35 female).
| Officers per 1,000 residents here: | 1.14 |
| California average: | 2.36 |
Full-time law enforcement employees in 2019, including police officers: 592 (418 officers - 381 male; 37 female).
| Officers per 1,000 residents here: | 1.18 |
| California average: | 2.35 |
Full-time law enforcement employees in 2018, including police officers: 597 (419 officers - 381 male; 38 female).
| Officers per 1,000 residents here: | 1.18 |
| California average: | 2.34 |
Full-time law enforcement employees in 2017, including police officers: 602 (419 officers - 378 male; 41 female).
| Officers per 1,000 residents here: | 1.19 |
| California average: | 2.32 |
Full-time law enforcement employees in 2016, including police officers: 562 (408 officers - 372 male; 36 female).
| Officers per 1,000 residents here: | 1.15 |
| California average: | 2.32 |
Full-time law enforcement employees in 2015, including police officers: 577 (399 officers - 356 male; 43 female).
| Officers per 1,000 residents here: | 1.14 |
| California average: | 1.98 |
Full-time law enforcement employees in 2014, including police officers: 550 (374 officers - 334 male; 40 female).
| Officers per 1,000 residents here: | 1.08 |
| California average: | 2.00 |
Full-time law enforcement employees in 2013, including police officers: 518 (361 officers - 326 male; 35 female).
| Officers per 1,000 residents here: | 1.05 |
| California average: | 2.34 |
Full-time law enforcement employees in 2012, including police officers: 506 (360 officers - 324 male; 36 female).
| Officers per 1,000 residents here: | 1.04 |
| California average: | 2.36 |
Full-time law enforcement employees in 2011, including police officers: 527 (374 officers - 337 male; 37 female).
| Officers per 1,000 residents here: | 1.10 |
| California average: | 2.09 |
Full-time law enforcement employees in 2010, including police officers: 548 (389 officers - 352 male; 37 female).
| Officers per 1,000 residents here: | 1.16 |
| California average: | 2.46 |
Full-time law enforcement employees in 2009, including police officers: 609 (405 officers - 365 male; 40 female).
| Officers per 1,000 residents here: | 1.21 |
| California average: | 2.52 |
Full-time law enforcement employees in 2008, including police officers: 606 (424 officers - 384 male; 40 female).
| Officers per 1,000 residents here: | 1.27 |
| California average: | 2.55 |
Full-time law enforcement employees in 2007, including police officers: 582 (412 officers - 375 male; 37 female).
| Officers per 1,000 residents here: | 1.23 |
| California average: | 2.48 |
Full-time law enforcement employees in 2006, including police officers: 579 (410 officers - 374 male; 36 female).
| Officers per 1,000 residents here: | 1.22 |
| California average: | 2.38 |
Full-time law enforcement employees in 2005, including police officers: 559 (396 officers - 358 male; 38 female).
| Officers per 1,000 residents here: | 1.18 |
| California average: | 2.34 |
Full-time law enforcement employees in 2004, including police officers: 586 (397 officers - 359 male; 38 female).
| Officers per 1,000 residents here: | 1.18 |
| California average: | 2.36 |
Full-time law enforcement employees in 2003, including police officers: 557 (389 officers - 353 male; 36 female).
| Officers per 1,000 residents here: | 1.16 |
| California average: | 2.42 |
Zip codes: 90620, 90621, 92801, 92802, 92804, 92805, 92806, 92807, 92808, 92867, 92868, 92870, 92886, 92887.