Crime rate in Alexandria, Virginia (VA): murders, rapes, robberies, assaults, burglaries, thefts, auto thefts, arson, law enforcement employees, police officers, crime map
Crime rate in Alexandria, VA
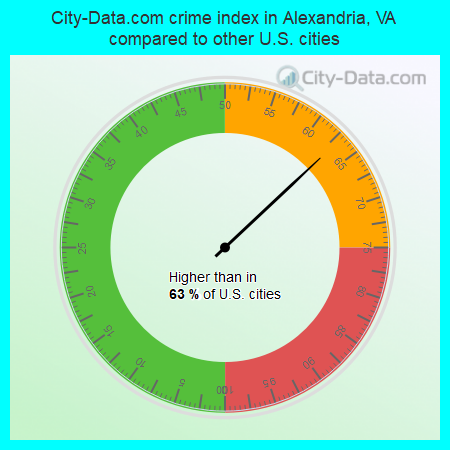
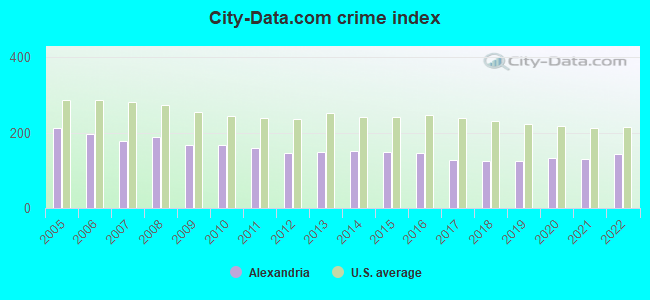
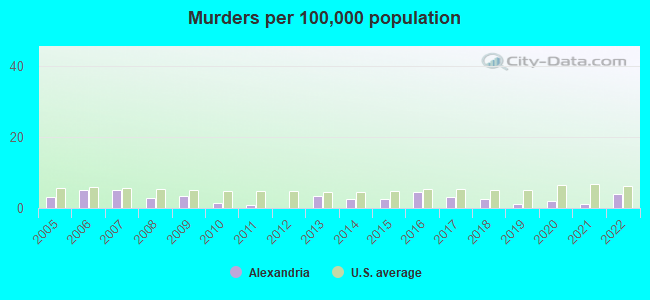
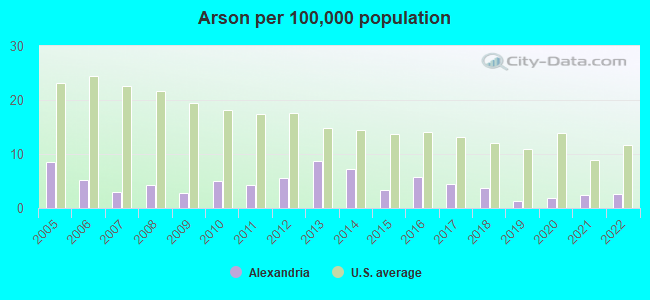
The 2022 crime rate in Alexandria, VA is 144 (City-Data.com crime index), which is 1.7 times lower than the U.S. average. It was higher than in 63.0% U.S. cities. The 2022 Alexandria crime rate rose by 10% compared to 2021. The number of homicides stood at 6 - an increase of 4 compared to 2021. In the last 5 years Alexandria has seen increasing violent crime and increasing property crime.See how dangerous Alexandria, VA is compared to the nearest cities:
(Note: Higher means more crime)
(Note: Higher means more crime)
| Alexandria: | 143.9 |
| Forest Heights: | 212.1 |
| Falls Church: | 101.2 |
| Washington: | 426.6 |
| Capitol Heights: | 193.6 |
| Morningside: | 262.6 |
| District Heights: | 137.9 |
| Fairmount Heights: | 283.7 |
| Mount Rainier: | 297.3 |
The City-Data.com crime index weighs serious crimes and violent crimes more heavily. Higher means more crime, U.S. average is 246.1. It adjusts for the number of visitors and daily workers commuting into cities.
- means the value is smaller than the state average.- means the value is about the same as the state average.
- means the value is bigger than the state average.
According to our research of Virginia and other state lists, there were 277 registered sex offenders living in Alexandria, Virginia as of May 17, 2024.
The ratio of all residents to sex offenders in Alexandria is 562 to 1.
The ratio of registered sex offenders to all residents in this city is lower than the state average.

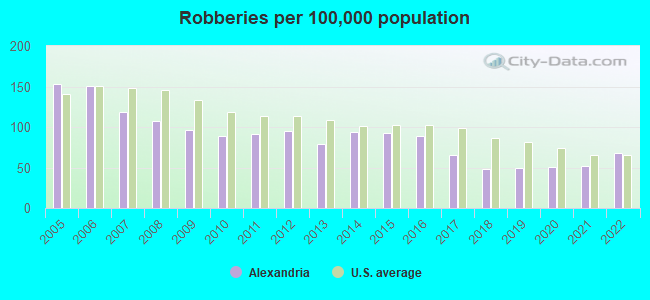
Violent crime rate in 2022
| Alexandria: | 101.4 |
| U.S. Average: | 219.8 |
Violent crime rate in 2021
| Alexandria: | 110.9 |
| U.S. Average: | 224.8 |
Violent crime rate in 2020
| Alexandria: | 101.5 |
| U.S. Average: | 228.2 |
Violent crime rate in 2019
| Alexandria: | 100.5 |
| U.S. Average: | 219.9 |
Violent crime rate in 2018
| Alexandria: | 94.4 |
| U.S. Average: | 221.2 |
Violent crime rate in 2017
| Alexandria: | 96.7 |
| U.S. Average: | 226.2 |
Violent crime rate in 2016
| Alexandria: | 106.2 |
| U.S. Average: | 227.3 |
Violent crime rate in 2015
| Alexandria: | 112.6 |
| U.S. Average: | 219.3 |
Violent crime rate in 2014
| Alexandria: | 104.9 |
| U.S. Average: | 211.1 |
Violent crime rate in 2013
| Alexandria: | 99.0 |
| U.S. Average: | 214.2 |
Violent crime rate in 2012
| Alexandria: | 86.7 |
| U.S. Average: | 187.4 |
Violent crime rate in 2011
| Alexandria: | 95.3 |
| U.S. Average: | 187.1 |
Violent crime rate in 2010
| Alexandria: | 107.2 |
| U.S. Average: | 195.7 |
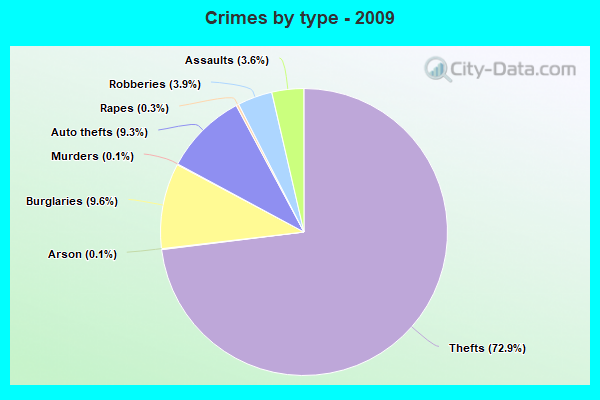
Violent crime rate in 2009
| Alexandria: | 107.8 |
| U.S. Average: | 208.9 |
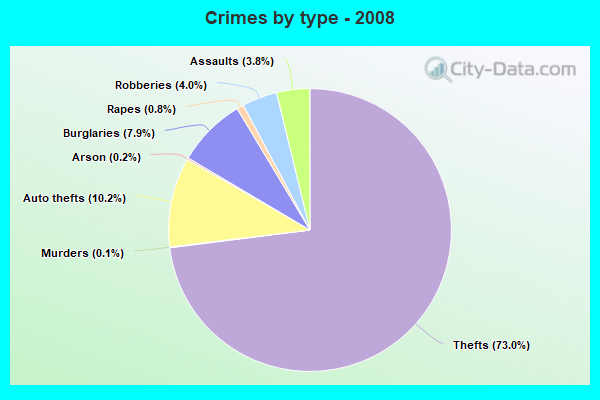
Violent crime rate in 2008
| Alexandria: | 130.6 |
| U.S. Average: | 222.5 |
Violent crime rate in 2007
| Alexandria: | 133.7 |
| U.S. Average: | 229.1 |
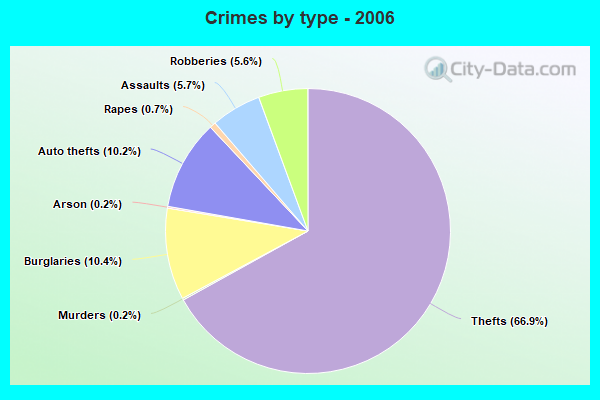
Violent crime rate in 2006
| Alexandria: | 165.4 |
| U.S. Average: | 232.6 |
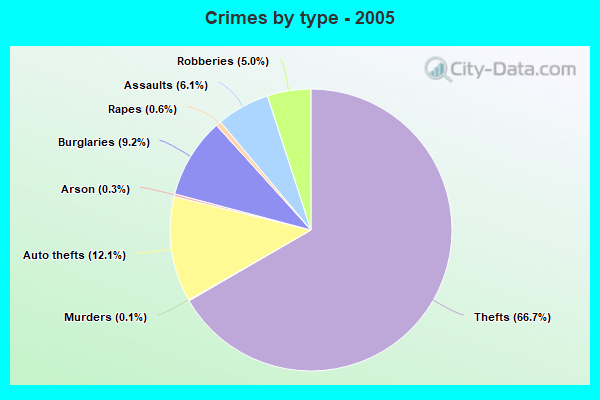
Violent crime rate in 2005
| Alexandria: | 175.2 |
| U.S. Average: | 227.0 |
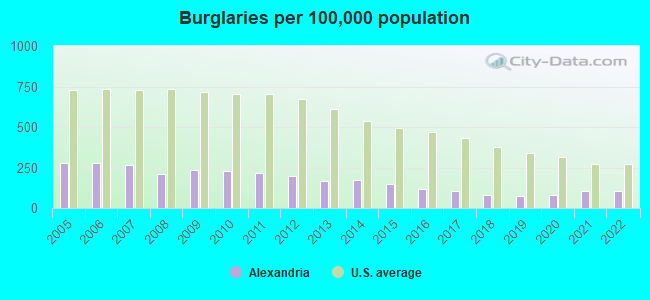
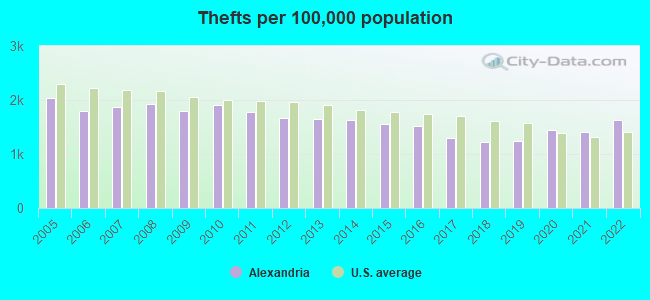
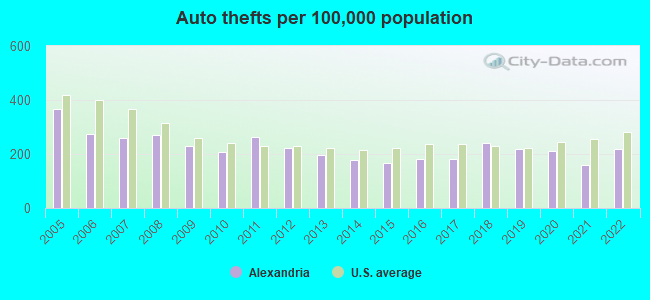
Property crime rate in 2022
| Alexandria: | 135.0 |
| U.S. Average: | 166.5 |
Property crime rate in 2021
| Alexandria: | 115.8 |
| U.S. Average: | 157.8 |
Property crime rate in 2020
| Alexandria: | 119.9 |
| U.S. Average: | 169.6 |
Property crime rate in 2019
| Alexandria: | 109.4 |
| U.S. Average: | 179.7 |
Property crime rate in 2018
| Alexandria: | 112.8 |
| U.S. Average: | 190.2 |
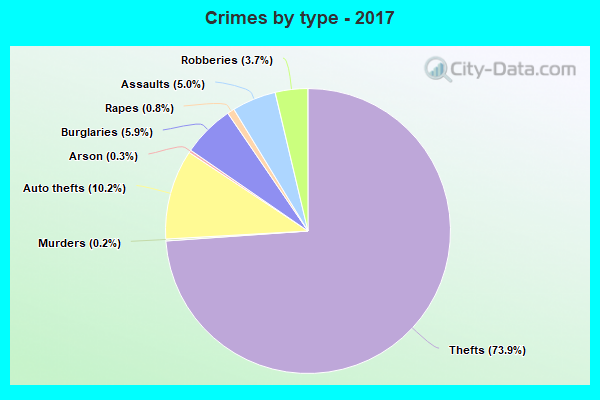
Property crime rate in 2017
| Alexandria: | 113.2 |
| U.S. Average: | 206.4 |
Property crime rate in 2016
| Alexandria: | 127.5 |
| U.S. Average: | 216.6 |
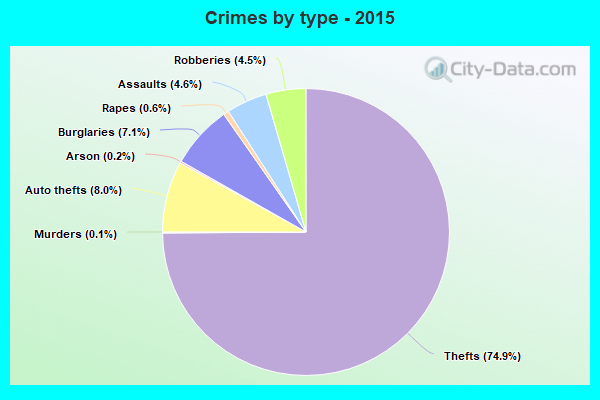
Property crime rate in 2015
| Alexandria: | 132.9 |
| U.S. Average: | 221.5 |
Property crime rate in 2014
| Alexandria: | 142.1 |
| U.S. Average: | 230.8 |
Property crime rate in 2013
| Alexandria: | 145.3 |
| U.S. Average: | 250.4 |
Property crime rate in 2012
| Alexandria: | 155.5 |
| U.S. Average: | 267.3 |
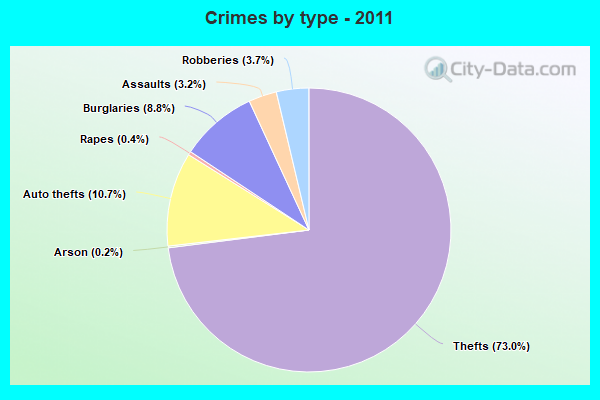
Property crime rate in 2011
| Alexandria: | 171.5 |
| U.S. Average: | 273.5 |
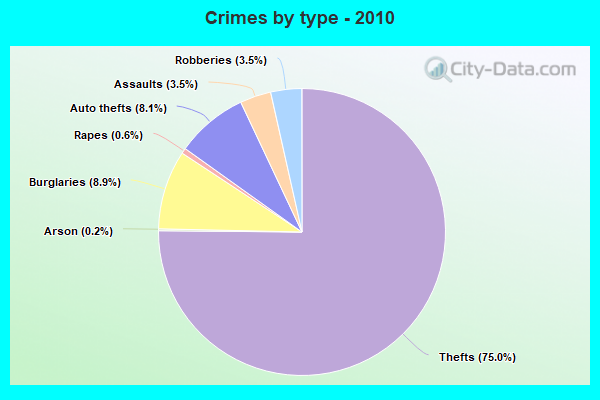
Property crime rate in 2010
| Alexandria: | 171.1 |
| U.S. Average: | 276.4 |
Property crime rate in 2009
| Alexandria: | 172.1 |
| U.S. Average: | 285.6 |
Property crime rate in 2008
| Alexandria: | 178.9 |
| U.S. Average: | 302.2 |
Property crime rate in 2007
| Alexandria: | 168.9 |
| U.S. Average: | 309.2 |
Property crime rate in 2006
| Alexandria: | 170.1 |
| U.S. Average: | 317.3 |
Property crime rate in 2005
| Alexandria: | 193.6 |
| U.S. Average: | 322.3 |

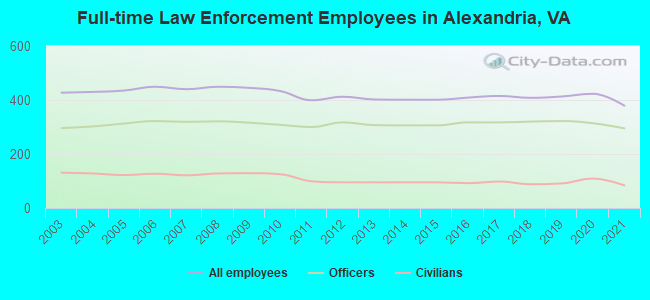
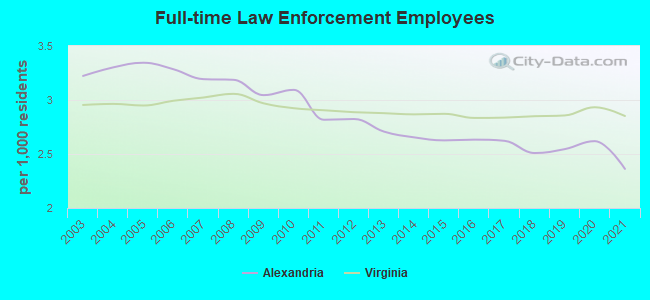
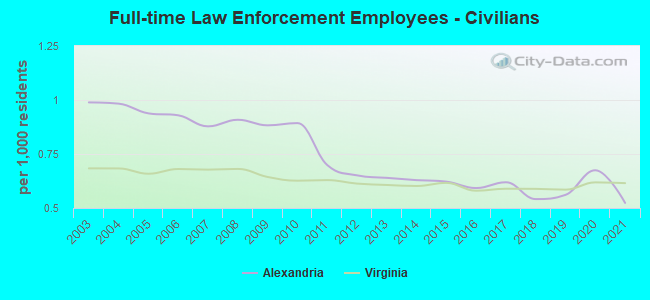
Full-time law enforcement employees in 2021, including police officers: 379 (295 officers - 234 male; 61 female).
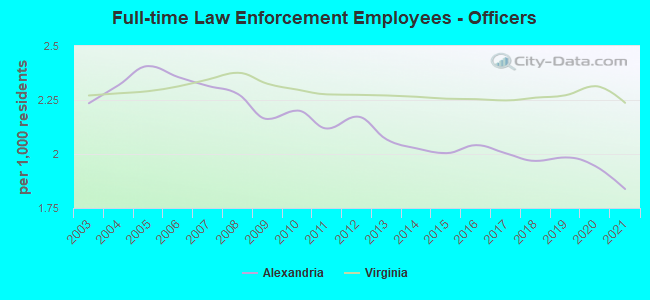
| Officers per 1,000 residents here: | 1.84 |
| Virginia average: | 2.24 |
Full-time law enforcement employees in 2020, including police officers: 423 (314 officers - 248 male; 66 female).
| Officers per 1,000 residents here: | 1.94 |
| Virginia average: | 2.31 |
Full-time law enforcement employees in 2019, including police officers: 413 (322 officers - 259 male; 63 female).
| Officers per 1,000 residents here: | 1.98 |
| Virginia average: | 2.27 |
Full-time law enforcement employees in 2018, including police officers: 408 (320 officers - 256 male; 64 female).
| Officers per 1,000 residents here: | 1.97 |
| Virginia average: | 2.26 |
Full-time law enforcement employees in 2017, including police officers: 415 (317 officers - 258 male; 59 female).
| Officers per 1,000 residents here: | 2.00 |
| Virginia average: | 2.25 |
Full-time law enforcement employees in 2016, including police officers: 409 (317 officers - 259 male; 58 female).
| Officers per 1,000 residents here: | 2.04 |
| Virginia average: | 2.25 |
Full-time law enforcement employees in 2015, including police officers: 401 (306 officers - 253 male; 53 female).
| Officers per 1,000 residents here: | 2.00 |
| Virginia average: | 2.26 |
Full-time law enforcement employees in 2014, including police officers: 401 (306 officers - 253 male; 53 female).
| Officers per 1,000 residents here: | 2.03 |
| Virginia average: | 2.27 |
Full-time law enforcement employees in 2013, including police officers: 402 (307 officers - 258 male; 49 female).
| Officers per 1,000 residents here: | 2.07 |
| Virginia average: | 2.27 |
Full-time law enforcement employees in 2012, including police officers: 412 (317 officers - 266 male; 51 female).
| Officers per 1,000 residents here: | 2.17 |
| Virginia average: | 2.27 |
Full-time law enforcement employees in 2011, including police officers: 399 (300 officers - 251 male; 49 female).
| Officers per 1,000 residents here: | 2.12 |
| Virginia average: | 2.28 |
Full-time law enforcement employees in 2010, including police officers: 433 (308 officers - 261 male; 47 female).
| Officers per 1,000 residents here: | 2.20 |
| Virginia average: | 2.30 |
Full-time law enforcement employees in 2009, including police officers: 445 (316 officers - 264 male; 52 female).
| Officers per 1,000 residents here: | 2.16 |
| Virginia average: | 2.32 |
Full-time law enforcement employees in 2008, including police officers: 449 (321 officers - 270 male; 51 female).
| Officers per 1,000 residents here: | 2.28 |
| Virginia average: | 2.38 |
Full-time law enforcement employees in 2007, including police officers: 440 (319 officers - 266 male; 53 female).
| Officers per 1,000 residents here: | 2.31 |
| Virginia average: | 2.34 |
Full-time law enforcement employees in 2006, including police officers: 449 (322 officers - 270 male; 52 female).
| Officers per 1,000 residents here: | 2.36 |
| Virginia average: | 2.31 |
Full-time law enforcement employees in 2005, including police officers: 435 (313 officers - 264 male; 49 female).
| Officers per 1,000 residents here: | 2.41 |
| Virginia average: | 2.29 |
Full-time law enforcement employees in 2004, including police officers: 430 (302 officers - 255 male; 47 female).
| Officers per 1,000 residents here: | 2.32 |
| Virginia average: | 2.28 |
Full-time law enforcement employees in 2003, including police officers: 427 (296 officers - 248 male; 48 female).
| Officers per 1,000 residents here: | 2.23 |
| Virginia average: | 2.27 |


Zip codes: 22206, 22301, 22302, 22304, 22305, 22311, 22312, 22314.