Crime rate in Albany, Georgia (GA): murders, rapes, robberies, assaults, burglaries, thefts, auto thefts, arson, law enforcement employees, police officers, crime map
Crime rate in Albany, GA
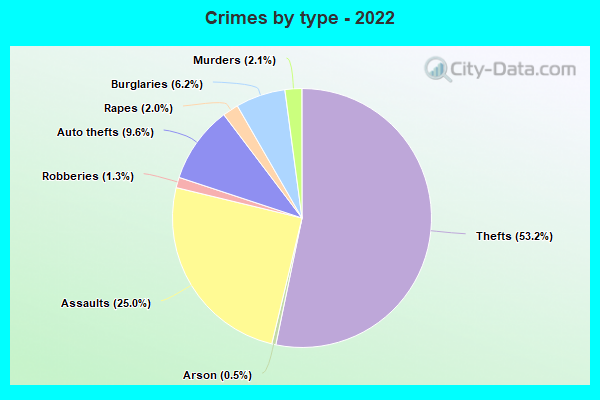
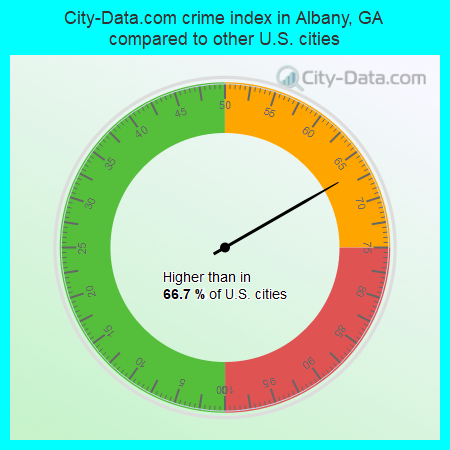
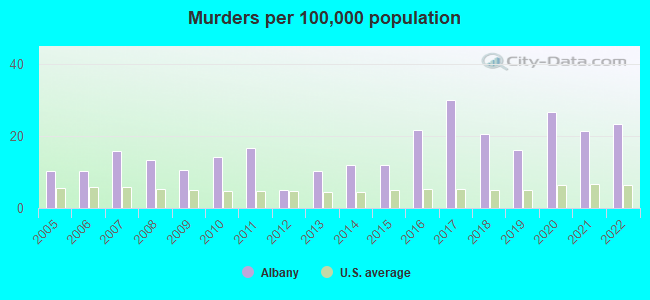
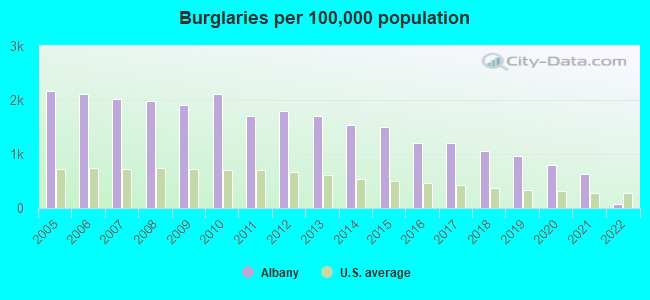
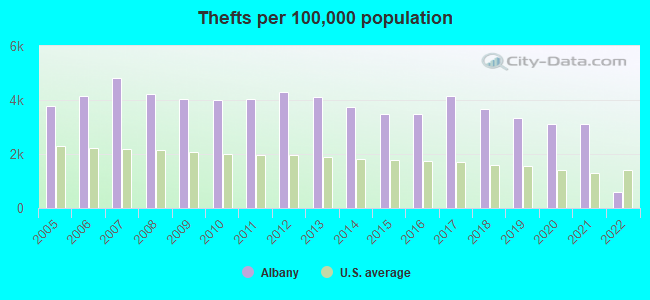
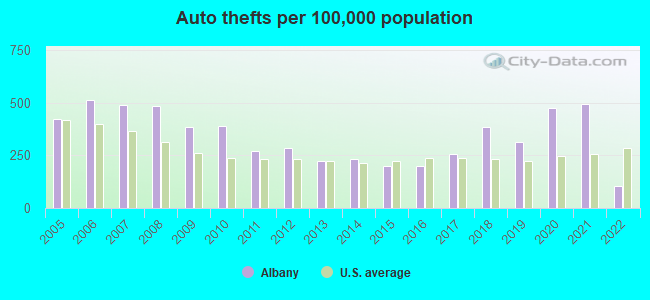
The 2022 crime rate in Albany, GA is 160 (City-Data.com crime index), which is 1.5 times smaller than the U.S. average. It was higher than in 66.7% U.S. cities. The 2022 Albany crime rate fell by 74% compared to 2021. The number of homicides stood at 16 - an increase of 1 compared to 2021. In the last 5 years Albany has seen decreasing violent crime and decreasing property crime.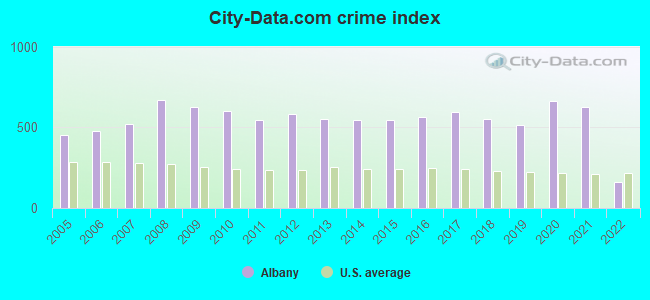
The City-Data.com crime index weighs serious crimes and violent crimes more heavily. Higher means more crime, U.S. average is 246.1. It adjusts for the number of visitors and daily workers commuting into cities.
- means the value is smaller than the state average.- means the value is about the same as the state average.
- means the value is bigger than the state average.
- means the value is much bigger than the state average.
According to our research of Georgia and other state lists, there were 387 registered sex offenders living in Albany, Georgia as of May 19, 2024.
The ratio of all residents to sex offenders in Albany is 200 to 1.
Violent crime rate in 2022
| Albany: | 212.8 |
| U.S. Average: | 219.8 |
Violent crime rate in 2021
| Albany: | 864.5 |
| U.S. Average: | 224.8 |
Violent crime rate in 2020
| Albany: | 929.2 |
| U.S. Average: | 228.2 |
Violent crime rate in 2019
| Albany: | 573.4 |
| U.S. Average: | 219.9 |
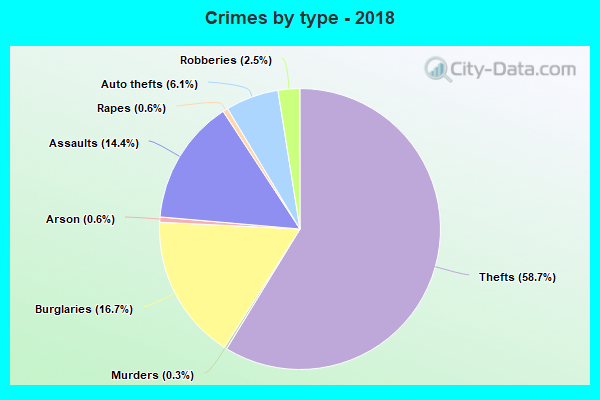
Violent crime rate in 2018
| Albany: | 607.5 |
| U.S. Average: | 221.2 |
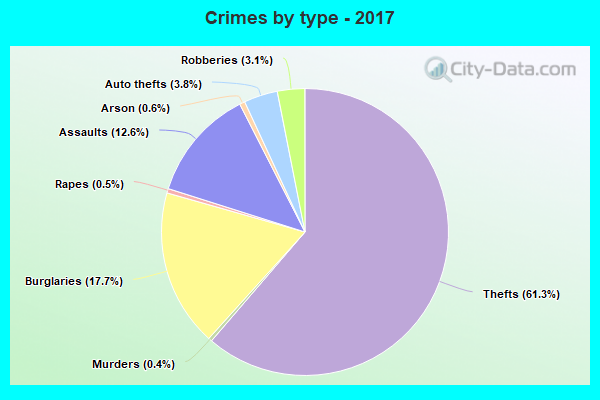
Violent crime rate in 2017
| Albany: | 628.3 |
| U.S. Average: | 226.2 |
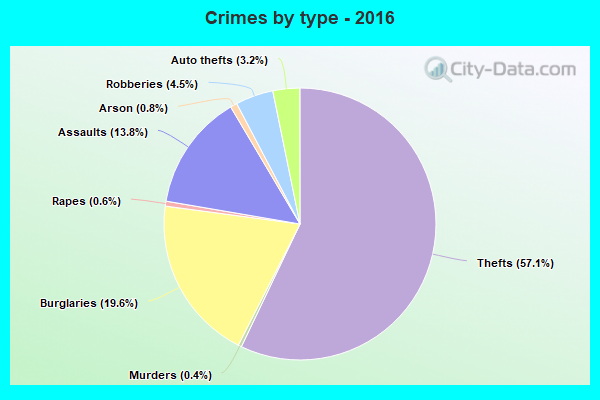
Violent crime rate in 2016
| Albany: | 638.4 |
| U.S. Average: | 227.3 |
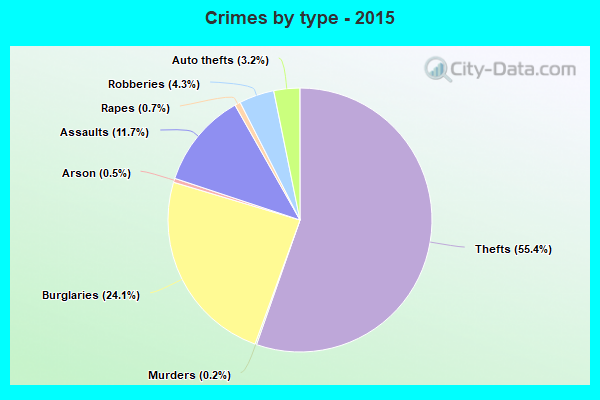
Violent crime rate in 2015
| Albany: | 571.3 |
| U.S. Average: | 219.3 |
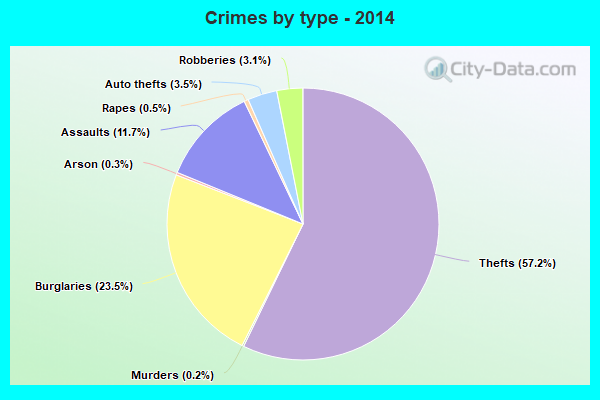
Violent crime rate in 2014
| Albany: | 545.8 |
| U.S. Average: | 211.1 |
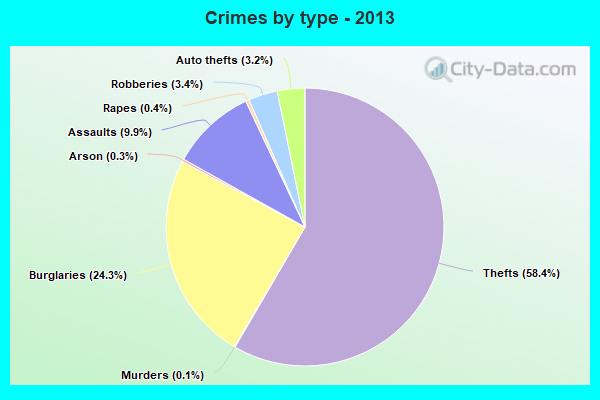
Violent crime rate in 2013
| Albany: | 513.2 |
| U.S. Average: | 214.2 |
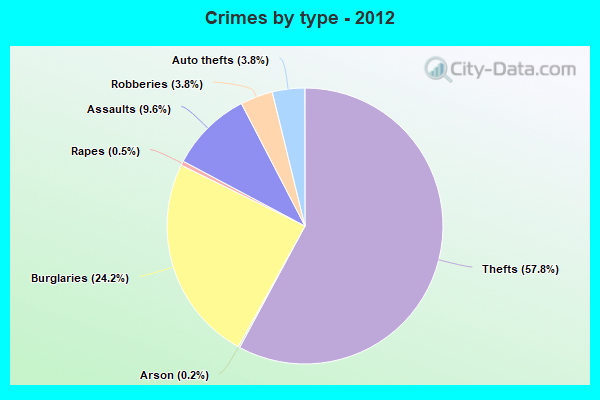
Violent crime rate in 2012
| Albany: | 542.6 |
| U.S. Average: | 187.4 |
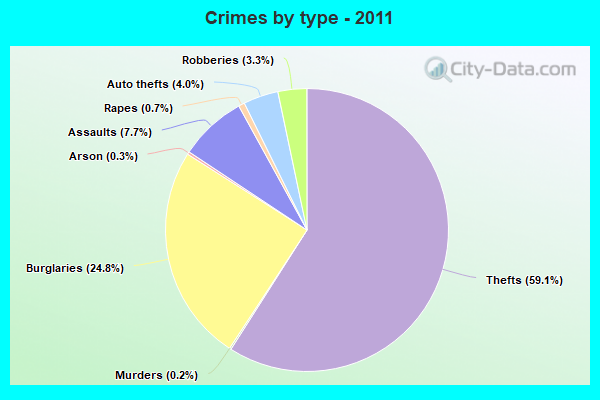
Violent crime rate in 2011
| Albany: | 456.3 |
| U.S. Average: | 187.1 |
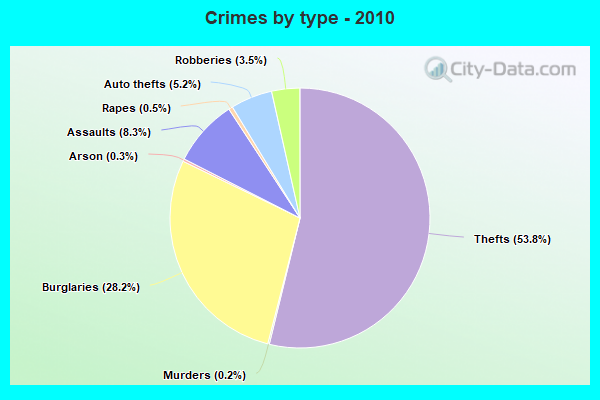
Violent crime rate in 2010
| Albany: | 505.6 |
| U.S. Average: | 195.7 |
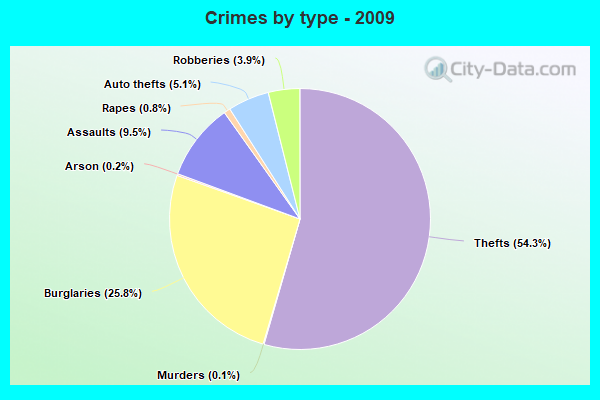
Violent crime rate in 2009
| Albany: | 583.0 |
| U.S. Average: | 208.9 |
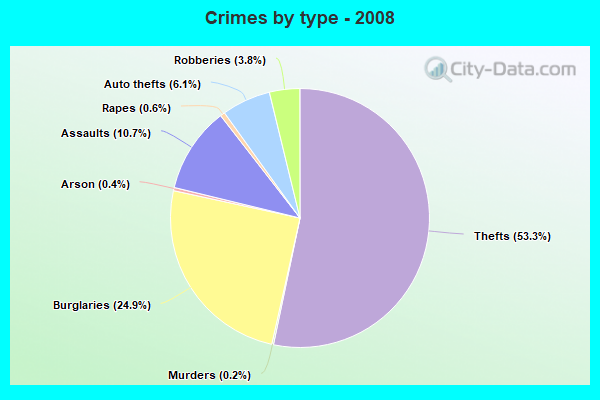
Violent crime rate in 2008
| Albany: | 647.2 |
| U.S. Average: | 222.5 |
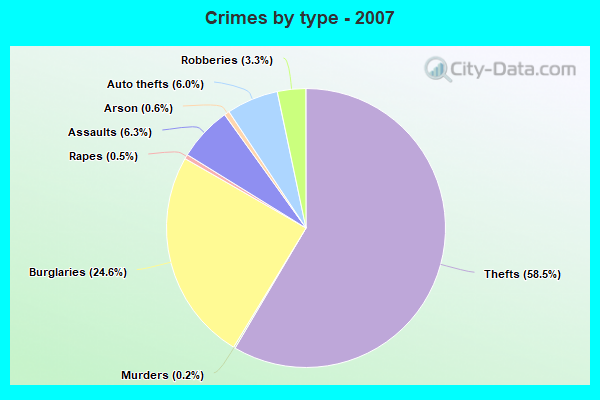
Violent crime rate in 2007
| Albany: | 389.4 |
| U.S. Average: | 229.1 |
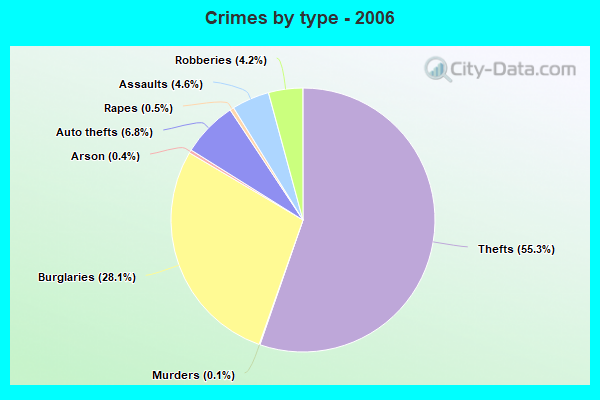
Violent crime rate in 2006
| Albany: | 324.3 |
| U.S. Average: | 232.6 |
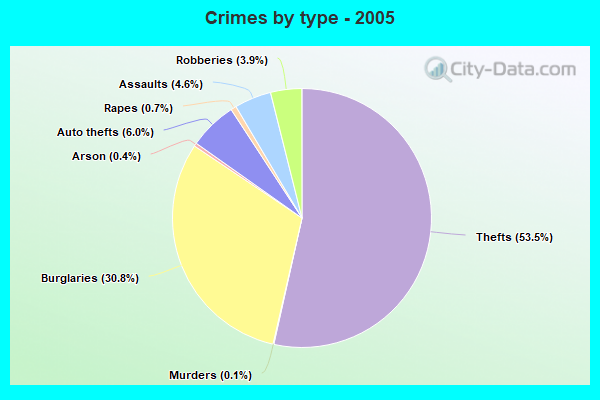
Violent crime rate in 2005
| Albany: | 307.2 |
| U.S. Average: | 227.0 |
Property crime rate in 2022
| Albany: | 58.6 |
| U.S. Average: | 166.5 |
Property crime rate in 2021
| Albany: | 356.6 |
| U.S. Average: | 157.8 |
Property crime rate in 2020
| Albany: | 388.0 |
| U.S. Average: | 169.6 |
Property crime rate in 2019
| Albany: | 407.2 |
| U.S. Average: | 179.7 |
Property crime rate in 2018
| Albany: | 450.5 |
| U.S. Average: | 190.2 |
Property crime rate in 2017
| Albany: | 487.0 |
| U.S. Average: | 206.4 |
Property crime rate in 2016
| Albany: | 442.5 |
| U.S. Average: | 216.6 |
Property crime rate in 2015
| Albany: | 505.0 |
| U.S. Average: | 221.5 |
Property crime rate in 2014
| Albany: | 531.4 |
| U.S. Average: | 230.8 |
Property crime rate in 2013
| Albany: | 579.3 |
| U.S. Average: | 250.4 |
Property crime rate in 2012
| Albany: | 616.0 |
| U.S. Average: | 267.3 |
Property crime rate in 2011
| Albany: | 582.6 |
| U.S. Average: | 273.5 |
Property crime rate in 2010
| Albany: | 679.5 |
| U.S. Average: | 276.4 |
Property crime rate in 2009
| Albany: | 641.7 |
| U.S. Average: | 285.6 |
Property crime rate in 2008
| Albany: | 678.8 |
| U.S. Average: | 302.2 |
Property crime rate in 2007
| Albany: | 596.4 |
| U.S. Average: | 309.2 |
Property crime rate in 2006
| Albany: | 587.4 |
| U.S. Average: | 317.3 |
Property crime rate in 2005
| Albany: | 570.0 |
| U.S. Average: | 322.3 |

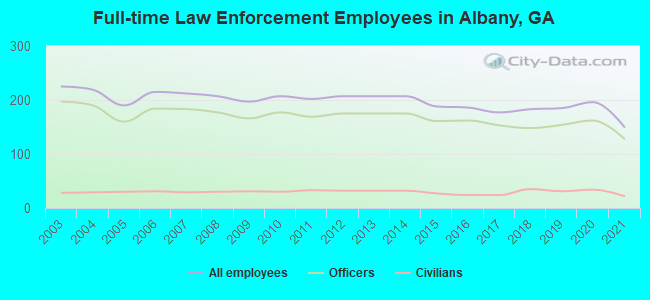
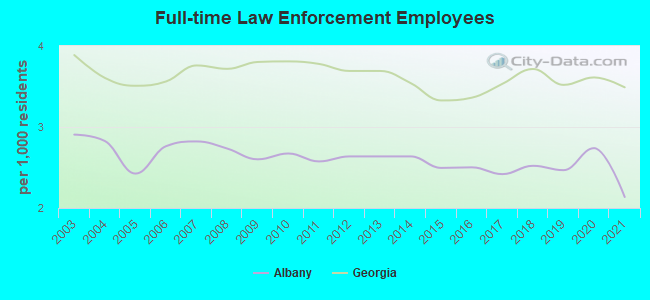
Full-time law enforcement employees in 2021, including police officers: 150 (128 officers - 91 male; 37 female).
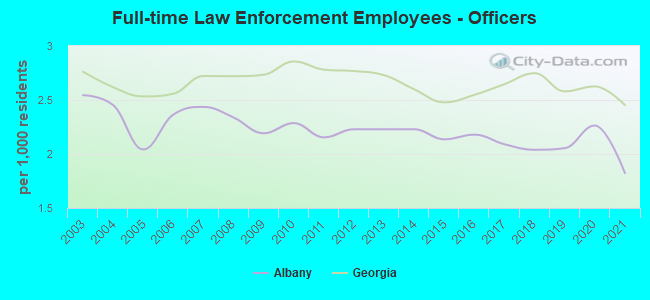
| Officers per 1,000 residents here: | 1.82 |
| Georgia average: | 2.45 |
Full-time law enforcement employees in 2020, including police officers: 196 (162 officers - 119 male; 43 female).
| Officers per 1,000 residents here: | 2.26 |
| Georgia average: | 2.63 |
Full-time law enforcement employees in 2019, including police officers: 185 (154 officers - 113 male; 41 female).
| Officers per 1,000 residents here: | 2.05 |
| Georgia average: | 2.58 |
Full-time law enforcement employees in 2018, including police officers: 183 (148 officers - 115 male; 33 female).
| Officers per 1,000 residents here: | 2.04 |
| Georgia average: | 2.75 |
Full-time law enforcement employees in 2017, including police officers: 177 (153 officers - 121 male; 32 female).
| Officers per 1,000 residents here: | 2.09 |
| Georgia average: | 2.65 |
Full-time law enforcement employees in 2016, including police officers: 186 (162 officers - 127 male; 35 female).
| Officers per 1,000 residents here: | 2.18 |
| Georgia average: | 2.55 |
Full-time law enforcement employees in 2015, including police officers: 188 (161 officers - 119 male; 42 female).
| Officers per 1,000 residents here: | 2.14 |
| Georgia average: | 2.48 |
Full-time law enforcement employees in 2012, including police officers: 207 (175 officers - 135 male; 40 female).
| Officers per 1,000 residents here: | 2.23 |
| Georgia average: | 2.77 |
Full-time law enforcement employees in 2011, including police officers: 202 (169 officers - 130 male; 39 female).
| Officers per 1,000 residents here: | 2.15 |
| Georgia average: | 2.78 |
Full-time law enforcement employees in 2010, including police officers: 207 (177 officers - 138 male; 39 female).
| Officers per 1,000 residents here: | 2.29 |
| Georgia average: | 2.86 |
Full-time law enforcement employees in 2009, including police officers: 197 (166 officers - 123 male; 43 female).
| Officers per 1,000 residents here: | 2.19 |
| Georgia average: | 2.73 |
Full-time law enforcement employees in 2008, including police officers: 207 (177 officers - 133 male; 44 female).
| Officers per 1,000 residents here: | 2.34 |
| Georgia average: | 2.72 |
Full-time law enforcement employees in 2007, including police officers: 212 (183 officers - 136 male; 47 female).
| Officers per 1,000 residents here: | 2.44 |
| Georgia average: | 2.72 |
Full-time law enforcement employees in 2006, including police officers: 215 (184 officers - 134 male; 50 female).
| Officers per 1,000 residents here: | 2.36 |
| Georgia average: | 2.56 |
Full-time law enforcement employees in 2005, including police officers: 190 (160 officers - 127 male; 33 female).
| Officers per 1,000 residents here: | 2.04 |
| Georgia average: | 2.53 |
Full-time law enforcement employees in 2004, including police officers: 219 (190 officers - 154 male; 36 female).
| Officers per 1,000 residents here: | 2.45 |
| Georgia average: | 2.62 |
Full-time law enforcement employees in 2003, including police officers: 225 (197 officers - 157 male; 40 female).
| Officers per 1,000 residents here: | 2.54 |
| Georgia average: | 2.76 |